
The US stock profit feast hit the “September Curse”! Wall Street sounded the alarm: historical rules may indicate a 7% drop
The Zhitong Finance App learned that after the S&P 500 index broke through the 7,800 historical milestone for the first time on August 13, Wall Street technical strategists are intensively issuing warnings: US stocks are entering the most dangerous seasonal window of the year with historically high levels, extremely low volatility, and extreme optimism. The Philadelphia Semiconductor Index is still mired in a bear market of more than 20% compared to its peak in June. J.P. Morgan's technical strategy director bluntly stated that “the adjustment is not really over yet,” while BTIG's chief technical analyst warned investors to “not be fooled by the perfect atmosphere” — from mid-August to mid-October in every midterm election year since 1990, weighted indices such as the S&P 500 fell by an average of 6%, and the S&P 500 index fell by an average of about 5%.
Profit “feast”: S&P 500 EPS soared 32%, Wall Street shouted 8,000 points
The second-quarter earnings season, which has just come to an end, handed over a report card that will go down in history. The EPS growth rate of the S&P 500 index constituent companies reached 32% year-on-year in the second quarter, continuing the strong momentum of 30% in the first quarter. More than 90% of the constituent stocks have announced financial reports, and the overall profit performance for the first half of the year is expected to be the best since 2021. The net profit margin has risen from 14% to close to 16%.
Wall Street strategists are raising their target prices at an unprecedented rate. J.P. Morgan raised the 2026 S&P 500 EPS forecast to $365 (+35% YoY), and raised the target price from 7,800 points to 8,000 points at the end of the year. Goldman Sachs expects EPS to reach $340 (+24%) in 2026, and nearly half of this increase directly comes from beneficiaries of AI infrastructure construction. Ed Yardeni, president of Yardeni Research, also raised the target price from 7,700 points to 8,250 points, and EPS is expected to rise from $310 to $330. Citi also raised its 2026 EPS forecast from $350 to $365, maintaining the year-end target of 8,100 points.
The core logic driving profit expansion is shifting from valuation expansion to profit improvement and AI commercialization. The cloud business of large technology companies such as Google, Amazon, and Microsoft is growing strongly, the backlog of orders has expanded, and the visibility of operating cash flow has increased. 87% of the S&P 500 constituent stocks have announced financial reports. Of these, 78% profit exceeded expectations and 73% revenue exceeded expectations.
The technical side shines red: S&P 500 approaches key resistance, semiconductors are mired in a bear market
However, the impressive performance of earnings did not heal the structural rift within the market. J.P. Morgan's technical strategist Jason Hunt warned in a report released on August 24 that although US stocks are still close to historical highs, there are many risk signals within the market. The S&P 500 recently hit an all-time high of 7816 points, but is still below the key resistance area of 7909 points to 7935 points. Hunter pointed out that the index's momentum is slowing near the long-term channel resistance level. Recently, market leadership has shifted, and existing AI-related leading stocks are showing a weak technical pattern.
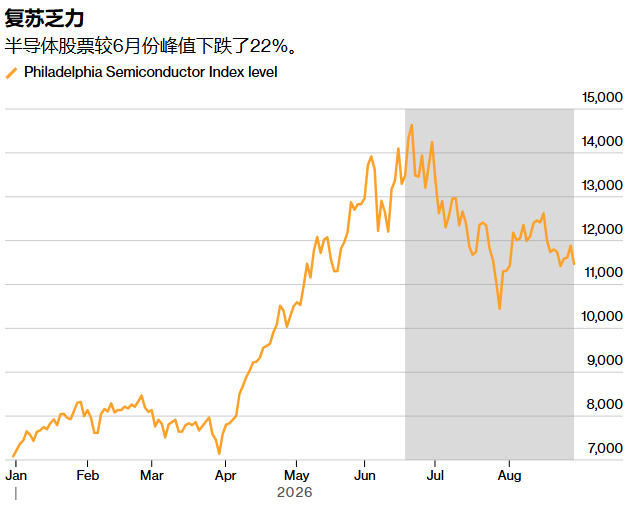
The semiconductor sector is in a particularly difficult situation. The Philadelphia Semiconductor Index (SOX) has retreated more than 21% from its high of 14,655 points in early July, meeting the definition of a “technical bear market.” By the close of August 28, SOX had fallen by 412.51 points (down 3.47%) to close at 11469.66 points. J.P. Morgan warned that the semiconductor index's current resistance zone is the dividing line between a short-term “dead cat rebound” and a restart of a multi-year upward trend. If it continues to trade below this region after Labor Day, the semiconductor index may face a new round of strong selling pressure throughout the fall.
BTIG's chief technical strategist Jonathan Klinsky further pointed out that in 2026, there have been 57 trading days where prices are contrary to market breadth trends, tied with the past two years for the highest number in nearly 30 years. So far this year, there has been no “full sell-off day” where the volume of falling transactions accounts for more than 80%. This means that the market has lacked a quick centralized clearance, and the pressure for systemic adjustments is still quietly accumulating.
September's “magic spell”: historical rules point to a 7% pullback from August to October of the midterm election year
Historical seasonal data provides more solid support for current market warnings. Since 1928, the average return of the S&P 500 index in September was about -1.2%. It was the only calendar month with a negative long-term average return. It recorded a decline of about 56% of the year. In the year of decline, the average pullback reached 7.35%. This seasonal weakness was more pronounced during the mid-term presidential term — in all midterm election years since 1974, the S&P 500 index had a median return of 0% from August 1 to November election day.
BTIG's data further revealed a more severe pattern in the midterm election year: since 1990, the equal-weighted S&P 500 index fell by at least 7% between August and October of each midterm election year, with the exception of 2006. The index usually peaks around August 18, then enters a rather difficult downward range until mid-October.
The data shows that in the midterm election year, from August 18 to October 11, the equal-weight S&P 500 index fell by an average of 6%, the standard S&P 500 fell by an average of about 5%, the Nasdaq Composite Index fell by an average of 7%, and the Russell 2000 index fell by an average of 8%. However, in non-midterm election years, the average returns of these three were basically the same for the same period.
BTIG notes in particular that the midterm elections themselves are not always the direct cause of fluctuations, and that an unknown external event often triggered the decline — such as the 1990 invasion of Kuwait, the 1998 long-term capital management company crisis, and the 2014 Ebola outbreak. This means that the potential risks facing the current market are just as difficult to predict.
Klinsky's warning is most straightforward: “The 'expansion of breadth' has occurred, and the atmosphere is flawless. Unfortunately, history tells us not to get too comfortable as we enter the worst period in the midterm election year calendar (August 18 to October 11).”
Sentiment and Volatility: Market complacency rises to extreme levels
Ned Davis Research's group sentiment and trading sentiment indicators all show that the market is already “overly optimistic” about the stock market. The company's analysts pointed out that when these two indicators are in this range at the same time, the market's performance is often weak. Furthermore, the November midterm elections further complicated the situation. The firm's analyst London Stockton wrote in an August 26 report: “This indicates that the market may fluctuate until some optimism subsides or the election is over.”
The 10-day moving average of CBOE's composite bearish/bullish ratio has fallen to 0.82, which is in the low range of the past few years, indicating that market participants are buying little protection for potential pullbacks. Meanwhile, the VIX Panic Index has been hovering near its low during the year. BTIG juxtaposed the market at an all-time high, VIX at a low point during the year, and the near-absence of protective demand, and believes that together they form a complete picture of the current high level of market complacency.
Klinsky further pointed out that since 2026, there has not been a single trading day where stocks have declined to account for more than 80% of the NYSE's trading volume. Historically, there have been an average of 21 such trading days per year, and no year in the past 30 years has had fewer than 5. Meanwhile, the VIX Panic Index has fallen to near its low point during the year — this kind of “perfect calm” is the most dangerous sign for the market.
Waiting for the weight index can't escape the “curse”: Seemingly safe havens conceal risks
Weight indices such as the S&P 500 (SPW) had a cumulative increase of about 16% during the year, outperforming the standard S&P 500's increase of about 12%. Klinsky said that the Weighting Index is currently “in a very good situation.” But he warned that investors should not be overly optimistic. Historical experience shows that SPW may have just begun to experience its worst in the midterm election year — from August 18 to October 11, SPW fell by an average of about 6% per year in the midterm elections.
Klinsky pointed out that the S&P 500 index actually “hasn't moved for two months,” and the market only showed a “chair grabbing” rotation of capital between different sectors. If capital rotation does not flow back to the technology and artificial intelligence sector, he expects the market to fall further: “All we see is money moving from one industry to another, like fluctuating in the water, but not going anywhere”, which is not enough to drive the market higher.
Strategy Insight: Trend Tracking and Defensive Layouts
Faced with a complex situation where strong profits are intertwined with multiple risks, Wall Street strategists have given prudent advice. J.P. Morgan Chase's Hunter advocates “following the trend” — using a trend-following stop-loss strategy rather than aggressively avoiding risk. “If we learn anything from the experience of the past one and a half to two years, it's that trying to get in before the recession is unwise.” The bank advises investors to consider moderately reducing their stock positions before the beginning of September.
BTIG's Klinsky proposed establishing defensive positions in the healthcare sector — this sector has performed best in the past three months, with an increase of more than 15%. Goldman Sachs, on the other hand, pointed out that the S&P 500's historical average correction from August to October is particularly noteworthy in the 2026 midterm election year.
September Key Variables: Nvidia Earnings Report, Federal Reserve Policy and Geopolitics
J.P. Morgan believes that there are some similarities between the current AI market and the Internet bubble period in 2000. In particular, there is fragmentation within the AI industry chain. The bank focuses on differences in trends between AI hardware companies and large cloud computing companies. It believes that this differentiation is similar to the characteristics of the market before the communication equipment capital investment cycle peaked in 2000.
At the same time, the AI industry is also facing policy pressure. Some regions of the US have begun to pay attention to energy demand issues brought about by data center expansion, and the Texas governor recently suspended approval for new data center projects. Wells Fargo's chief stock strategist said that the political resistance surrounding AI and data centers is an important risk that the market needs to pay attention to before entering the midterm election cycle.