
3 Asian Stocks Estimated To Be Up To 49.7% Below Intrinsic Value
As Asian markets navigate a complex landscape of economic recovery and technological advancements, investors are increasingly focused on identifying opportunities that may be undervalued. In this context, a good stock is often characterized by strong fundamentals and growth potential that may not yet be fully recognized by the market, offering an attractive entry point for those looking to capitalize on these conditions.
Top 10 Undervalued Stocks Based On Cash Flows In Asia
| Name | Current Price | Fair Value (Est) | Discount (Est) |
| TLB (KOSDAQ:A356860) | ₩42000.00 | ₩83336.37 | 49.6% |
| SILICON2 (KOSDAQ:A257720) | ₩54200.00 | ₩107247.13 | 49.5% |
| Shiyue Daotian Group (SEHK:9676) | HK$4.665 | HK$9.20 | 49.3% |
| Shengda ResourcesLtd (SZSE:000603) | CN¥36.87 | CN¥73.03 | 49.5% |
| Quality Reliability Technology (KOSDAQ:A405100) | ₩12450.00 | ₩24725.50 | 49.6% |
| HUMAN MADE (TSE:456A) | ¥1680.00 | ¥3339.41 | 49.7% |
| Hubei Three Gorges Tourism Group (SZSE:002627) | CN¥7.14 | CN¥14.17 | 49.6% |
| gremsInc (TSE:3150) | ¥2490.00 | ¥4915.14 | 49.3% |
| China Tobacco International (HK) (SEHK:6055) | HK$24.62 | HK$48.37 | 49.1% |
| APR (KOSE:A278470) | ₩464500.00 | ₩924145.78 | 49.7% |
Let's uncover some gems from our specialized screener.
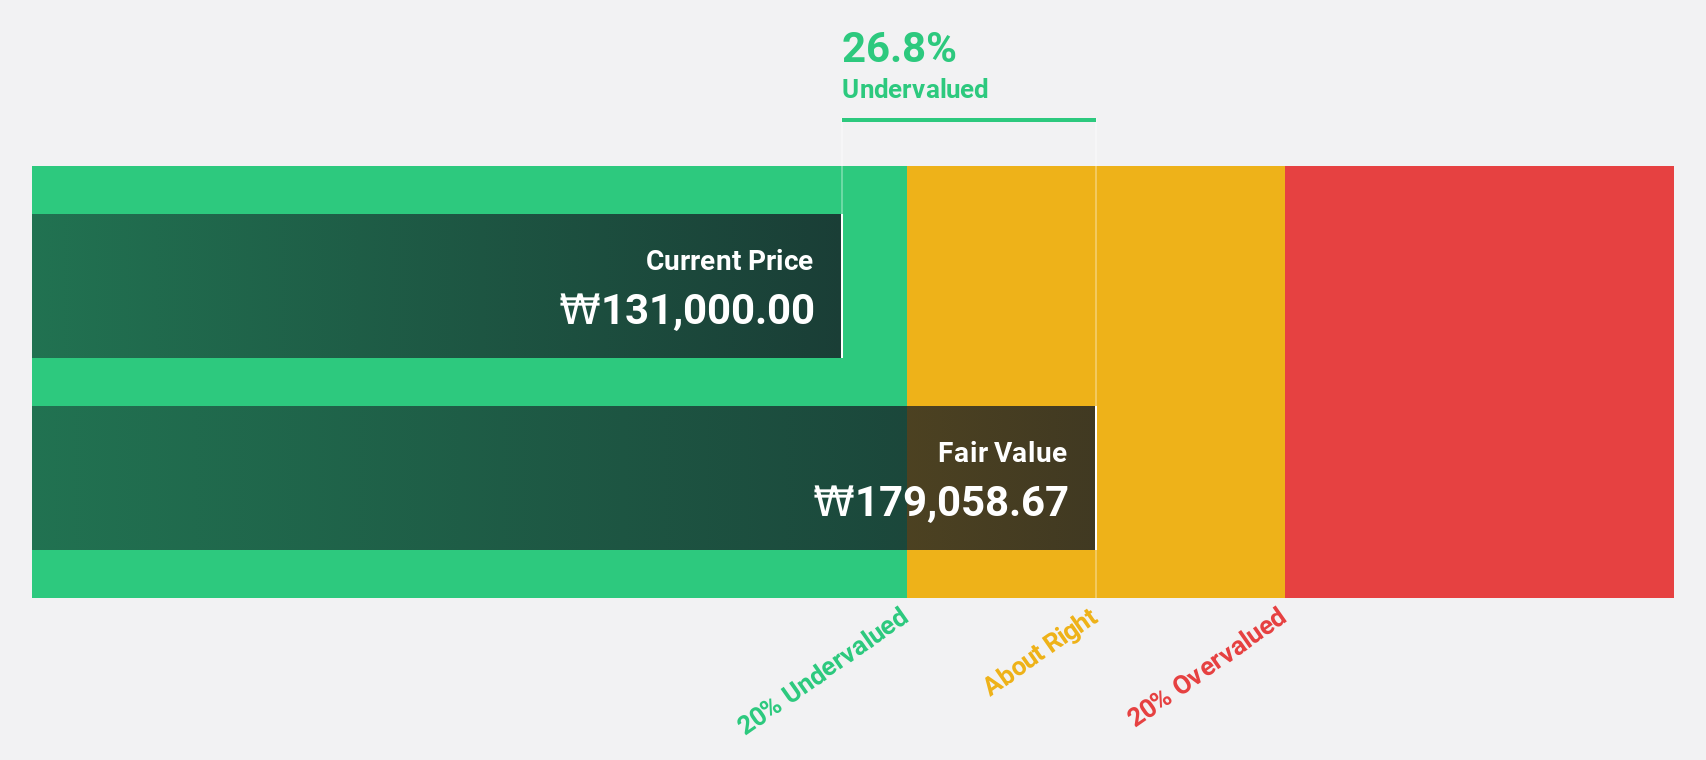
APR (KOSE:A278470)
Overview: APR Co., Ltd. manufactures and sells cosmetic products for men and women, with a market cap of ₩17.39 trillion.
Operations: The company's revenue segments include cosmetics, generating ₩2.39 trillion, and clothing and fashion department, contributing ₩22.10 billion.
Estimated Discount To Fair Value: 49.7%
APR Co., Ltd. is trading at ₩464,500, significantly below its estimated future cash flow value of ₩924.15K, indicating potential undervaluation based on cash flows. The company's earnings are forecast to grow at 33.4% annually, outpacing the KR market's 27.1%, with revenue growth expected at 32.1% per year. Recent product expansions in North America and Europe further bolster its growth trajectory, enhancing APR's position in the global skincare market.
- In light of our recent growth report, it seems possible that APR's financial performance will exceed current levels.
- Click to explore a detailed breakdown of our findings in APR's balance sheet health report.
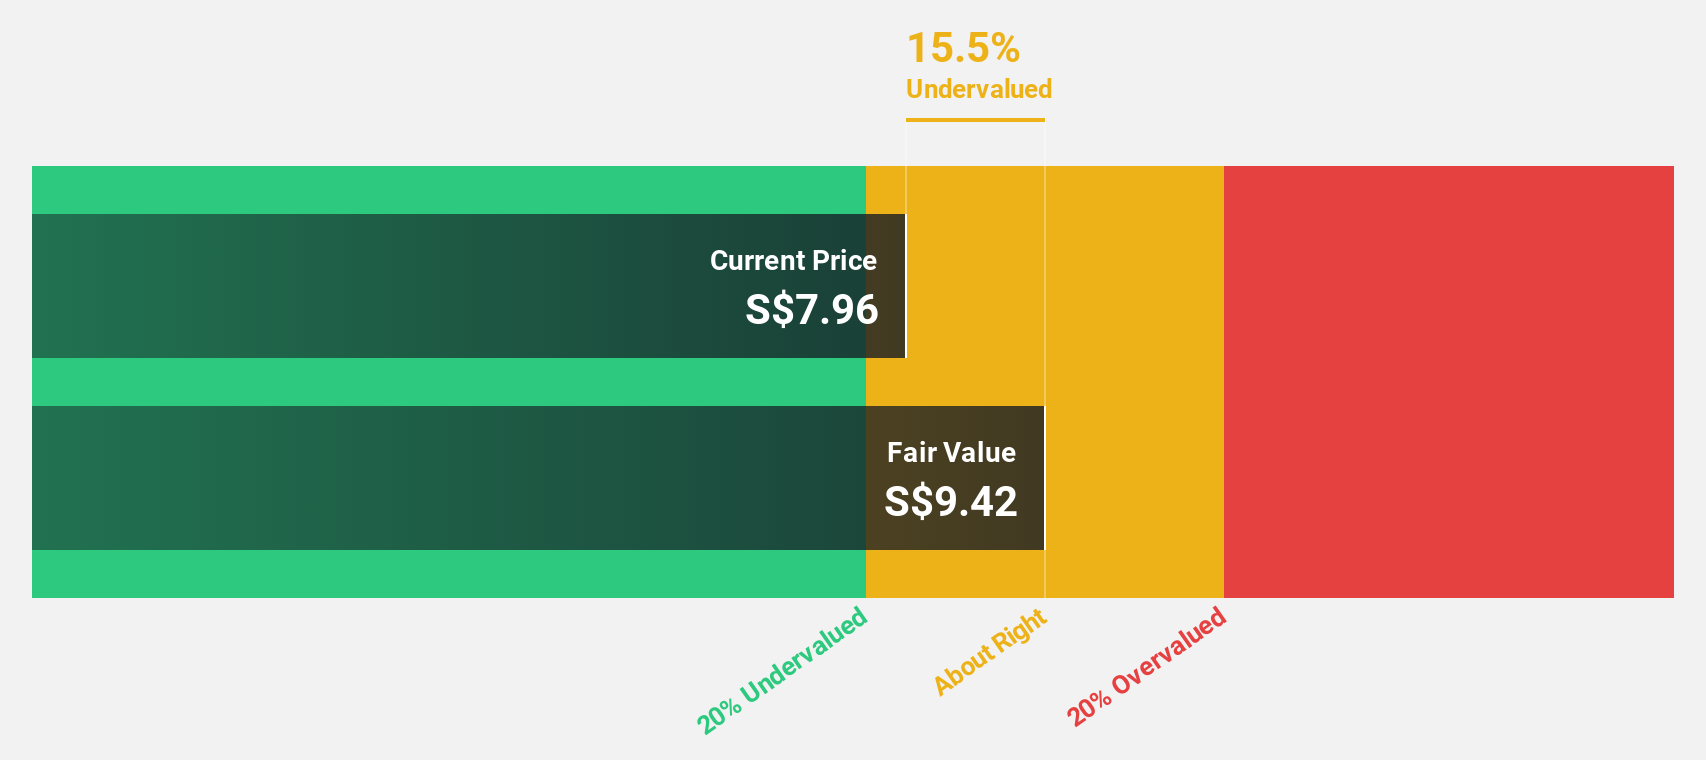
Singapore Technologies Engineering (SGX:S63)
Overview: Singapore Technologies Engineering Ltd is a global technology, defence, and engineering company with a market cap of SGD33.66 billion.
Operations: The company's revenue segments include Commercial Aerospace at SGD5.39 billion, Urban Solutions & Satcom at SGD2.22 billion, and Defence & Public Security at SGD5.59 billion.
Estimated Discount To Fair Value: 14.1%
Singapore Technologies Engineering is trading at S$10.79, below its estimated future cash flow value of S$12.57, suggesting it may be undervalued based on cash flows. Despite a high level of debt and lower profit margins year-over-year, earnings are forecast to grow significantly at 20.1% annually, surpassing the Singapore market's growth rate. Recent contract wins totaling S$2.9 billion and a robust order book of S$35.7 billion bolster its financial outlook.
- Our expertly prepared growth report on Singapore Technologies Engineering implies its future financial outlook may be stronger than recent results.
- Delve into the full analysis health report here for a deeper understanding of Singapore Technologies Engineering.
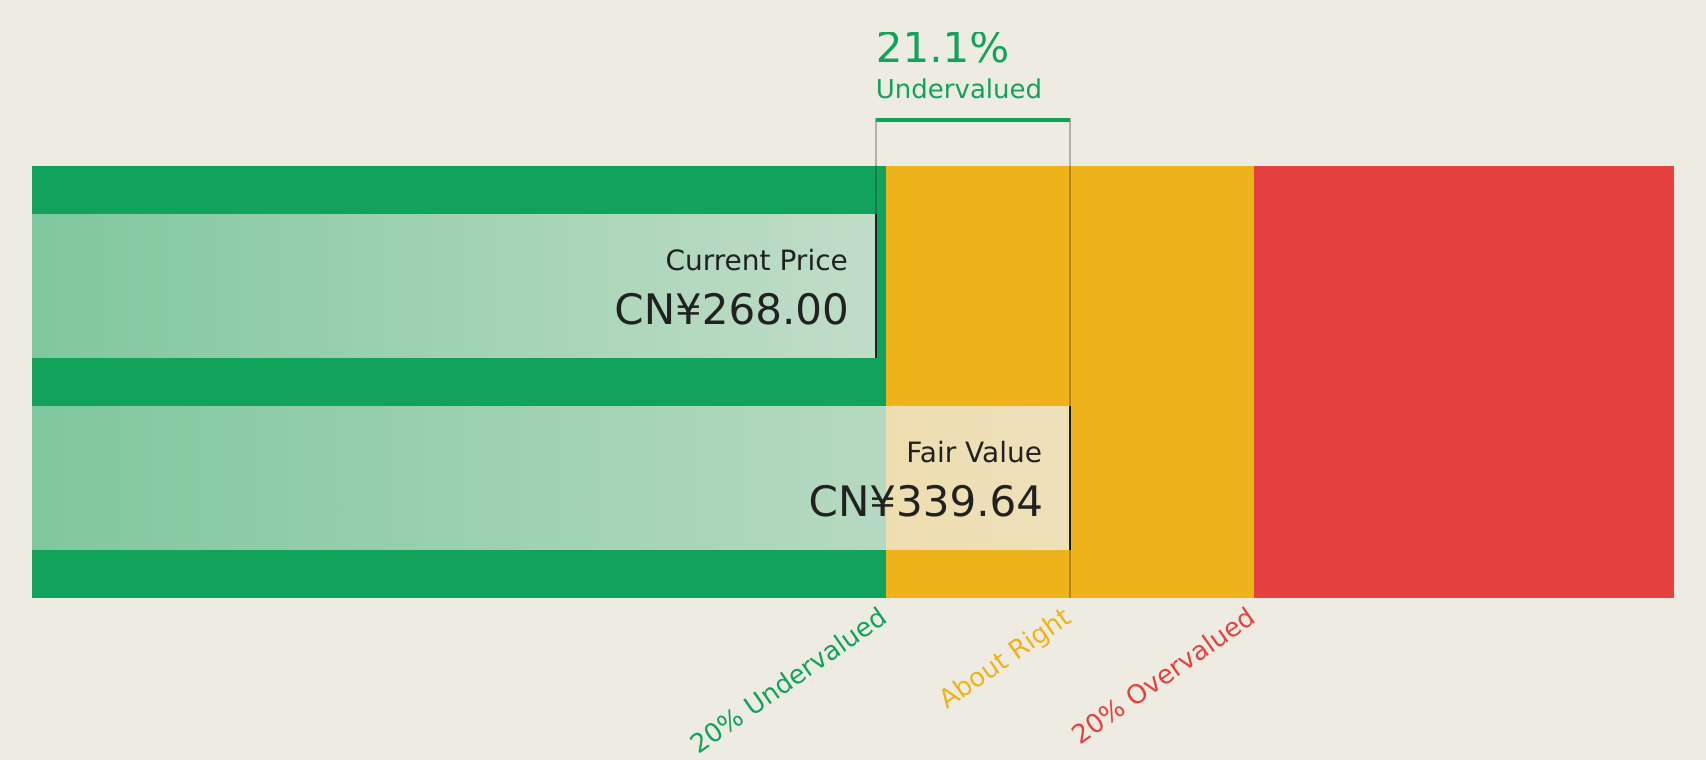
Shenzhen Han's CNC Technology (SZSE:301200)
Overview: Shenzhen Han's CNC Technology Co., Ltd. focuses on the research, development, manufacture, and sale of printed circuit boards and related products both in China and internationally, with a market cap of approximately CN¥126.35 billion.
Operations: The company's revenue from the Special Equipment Manufacturing Industry amounts to CN¥8.38 billion.
Estimated Discount To Fair Value: 17.5%
Shenzhen Han's CNC Technology, trading at CN¥280, is below its estimated future cash flow value of CN¥339.37. Despite high volatility, the company shows strong earnings growth and revenue expansion driven by AI PCB-related solutions. Recent financials reveal a substantial increase in net income to CN¥956.86 million for H1 2026 from CN¥263.27 million a year ago, highlighting its potential as an undervalued stock based on cash flows in Asia.
- Insights from our recent growth report point to a promising forecast for Shenzhen Han's CNC Technology's business outlook.
- Get an in-depth perspective on Shenzhen Han's CNC Technology's balance sheet by reading our health report here.
Turning Ideas Into Actions
- Unlock our comprehensive list of 210 Undervalued Asian Stocks Based On Cash Flows by clicking here.
- Already own these companies? Link your portfolio to Simply Wall St and get alerts on any new warning signs to your stocks.
- Simply Wall St is your key to unlocking global market trends, a free user-friendly app for forward-thinking investors.
Ready For A Different Approach?
- Explore high-performing small cap companies that haven't yet garnered significant analyst attention.
- Diversify your portfolio with solid dividend payers offering reliable income streams to weather potential market turbulence.
- Fuel your portfolio with companies showing strong growth potential, backed by optimistic outlooks both from analysts and management.
This article by Simply Wall St is general in nature. We provide commentary based on historical data and analyst forecasts only using an unbiased methodology and our articles are not intended to be financial advice. It does not constitute a recommendation to buy or sell any stock, and does not take account of your objectives, or your financial situation. We aim to bring you long-term focused analysis driven by fundamental data. Note that our analysis may not factor in the latest price-sensitive company announcements or qualitative material. Simply Wall St has no position in any stocks mentioned.
Have feedback on this article? Concerned about the content? Get in touch with us directly. Alternatively, email editorial-team@simplywallst.com