
European Penny Stocks: Piquadro And 2 Other Promising Picks
As European markets navigate mixed economic signals and geopolitical developments, the pan-European STOXX Europe 600 Index remains relatively stable, reflecting both investor caution and optimism. Amidst this backdrop, penny stocks—often smaller or newer companies—continue to present unique opportunities for investors seeking growth potential at lower price points. While the term "penny stocks" may seem outdated, their potential remains significant when these companies are supported by solid financials and robust fundamentals.
Here we highlight a subset of our preferred stocks from the screener.
Piquadro (BIT:PQ)
Simply Wall St Financial Health Rating: ★★★★★★
Overview: Piquadro S.p.A. designs, produces, and markets leather goods and accessories both in Italy and internationally, with a market cap of €119.69 million.
Operations: The company's revenue is derived from three main segments: Lancel (€74.45 million), Piquadro (€73.22 million), and The Bridge (€36.65 million).
Market Cap: €119.69M
Piquadro S.p.A. presents a mixed picture for investors interested in penny stocks. With a market cap of €119.69 million, the company has demonstrated financial stability, as evidenced by its operating cash flow covering 159.2% of its debt and short-term assets exceeding both short and long-term liabilities. The stock appears undervalued with a price-to-earnings ratio of 9.3x compared to the Italian market average of 17.6x, though its Return on Equity is relatively low at 17.2%. Recent earnings growth was modest at 11.2%, yet it outpaced the luxury industry’s average growth rate of 7%. Despite an unstable dividend track record, Piquadro announced an annual dividend payout recently, indicating potential income for shareholders amidst stable weekly volatility and improved profit margins over the past year.
- Jump into the full analysis health report here for a deeper understanding of Piquadro.
- Learn about Piquadro's future growth trajectory here.

Beyond Frames Entertainment (DB:8WP)
Simply Wall St Financial Health Rating: ★★★★☆☆
Overview: Beyond Frames Entertainment AB (publ) is a Swedish games company focused on developing and publishing games, with a market cap of €53.67 million.
Operations: No specific revenue segments have been reported for Beyond Frames Entertainment.
Market Cap: €53.67M
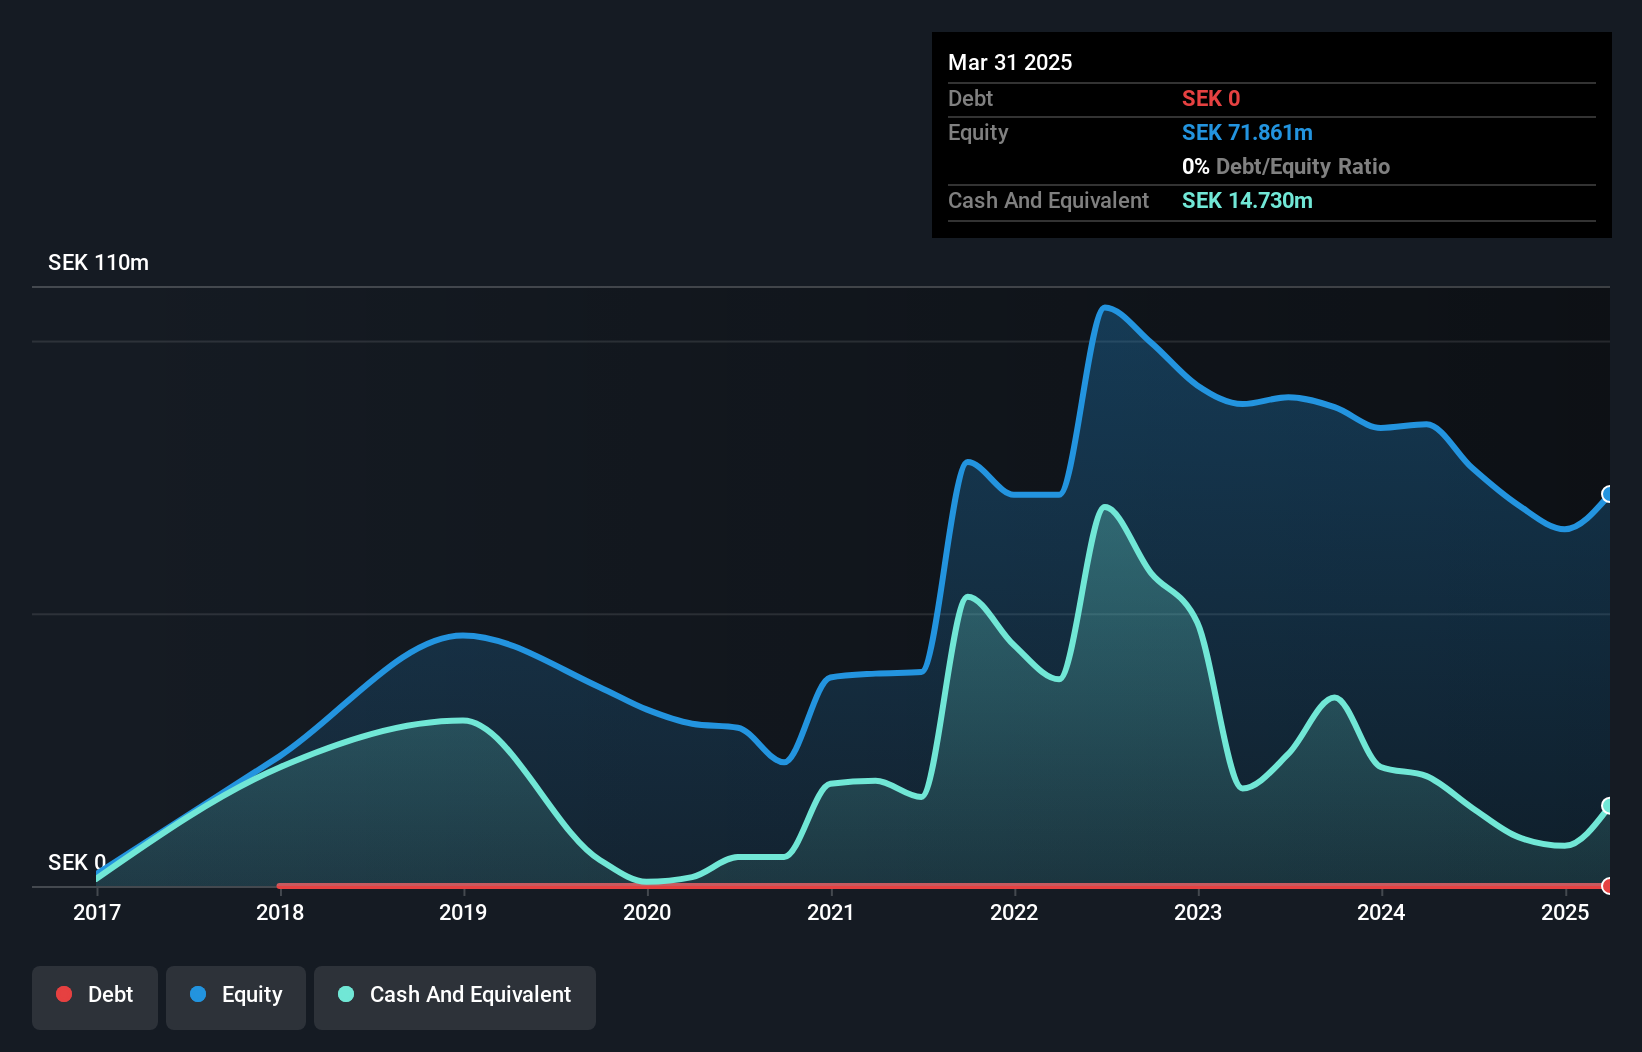
Beyond Frames Entertainment AB, with a market cap of €53.67 million, faces challenges typical of penny stocks. The company is unprofitable, reporting a net loss of SEK 8.97 million in Q2 2026, up from SEK 2.9 million the previous year, despite revenue reaching SEK 23.35 million compared to SEK 40.51 million last year. Short-term liabilities exceed short-term assets by a significant margin (SEK16.3M vs SEK35.5M), but it maintains more cash than total debt and has a sufficient cash runway for over three years due to positive free cash flow growth at 7.2% annually amidst increasing share price volatility and recent ownership changes following M&A activities and equity offerings.
- Take a closer look at Beyond Frames Entertainment's potential here in our financial health report.
- Gain insights into Beyond Frames Entertainment's outlook and expected performance with our report on the company's earnings estimates.
Skandia GreenPower (OB:SKAND)
Simply Wall St Financial Health Rating: ★★★★★☆
Overview: Skandia GreenPower AS, along with its subsidiaries, offers electricity and energy-saving services in Norway and has a market capitalization of NOK186.96 million.
Operations: Revenue Segments: No specific revenue segments have been reported.
Market Cap: NOK186.96M
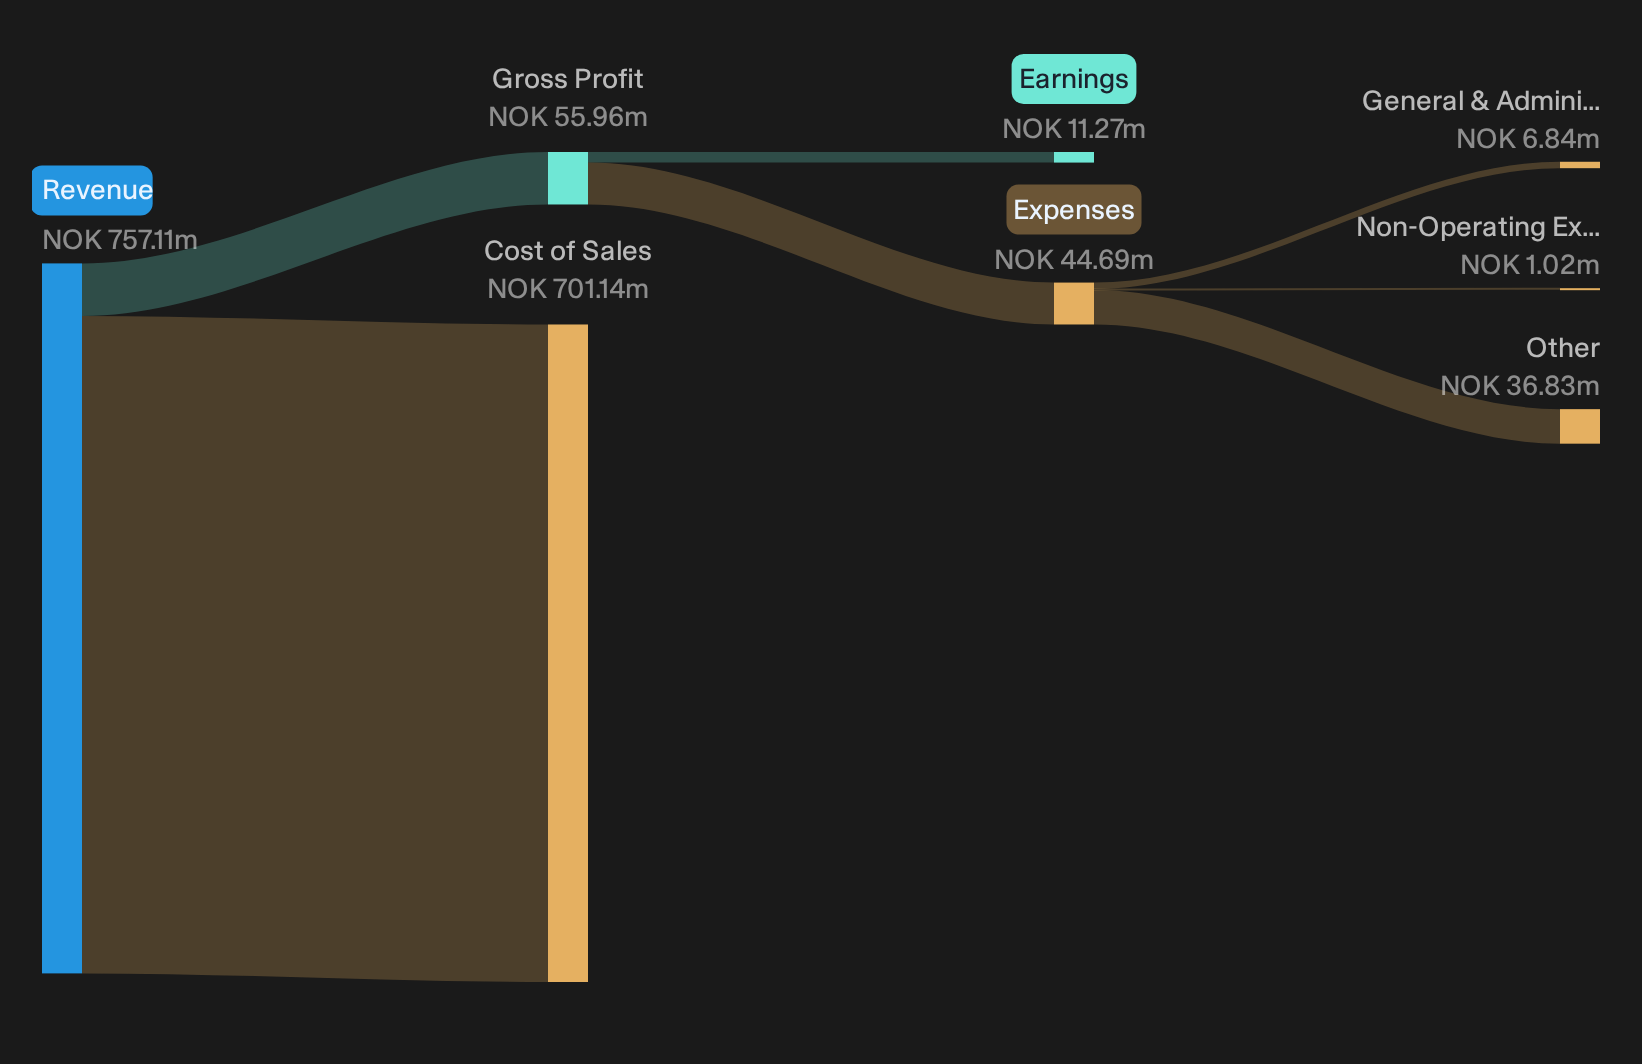
Skandia GreenPower AS, with a market cap of NOK186.96 million, has shown mixed performance typical of penny stocks. The company is debt-free and its board and management are experienced. Despite becoming profitable over the past five years, recent earnings growth has been negative at -26.9%, underperforming the industry average. Its net profit margin declined from 3.4% to 1.5% year-over-year, though sales increased significantly to NOK504.58 million for H1 2026 from NOK286.24 million last year, boosting net income to NOK5.31 million from NOK4.2 million previously amidst ongoing share price volatility.
- Dive into the specifics of Skandia GreenPower here with our thorough balance sheet health report.
- Review our historical performance report to gain insights into Skandia GreenPower's track record.
Next Steps
- Embark on your investment journey to our 309 European Penny Stocks selection here.
- Searching for a Fresh Perspective? AI is about to change healthcare. These 133 stocks are working on everything from early diagnostics to drug discovery. The best part - they are all under $10b in market cap - there's still time to get in early.
This article by Simply Wall St is general in nature. We provide commentary based on historical data and analyst forecasts only using an unbiased methodology and our articles are not intended to be financial advice. It does not constitute a recommendation to buy or sell any stock, and does not take account of your objectives, or your financial situation. We aim to bring you long-term focused analysis driven by fundamental data. Note that our analysis may not factor in the latest price-sensitive company announcements or qualitative material. Simply Wall St has no position in any stocks mentioned.
Have feedback on this article? Concerned about the content? Get in touch with us directly. Alternatively, email editorial-team@simplywallst.com