
Cui Dongshu: World car sales reached 56.11 million units in January-July, and the share of new energy vehicles reached 24.1%
The Zhitong Finance App learned that in January-July 2026, world car sales will reach 56.11 million units and 13.52 million new energy vehicles. From January to July 2026, the share of new energy vehicles reached 24.1%, of which pure electric vehicles accounted for 16.8%, and plug-in hybrid vehicles reached 7.3%. The hybrid achieved excellent performance of 8.1%.
Due to the sharp recovery of new energy trends in Europe, sales of new energy vehicles in overseas countries increased 29% by 780,000 units in July; overseas NEVs sold 5.11 million units in January-July, and the growth rate reached 30%, which is close to the average of the previous two years. Among them, US NEV sales in July 2026 fell 37% year on year, and sales of US NEVs were 710,000 in January-July, a decrease of 29%. European new energy passenger vehicles sold 3.86 million units in 2025, an increase of 960,000 units over the same period last year, an increase of 33%. According to preliminary statistics, Europe's 410,000 new energy passenger vehicles increased 38% year on year in July, and 2.79 million units increased 34% year on year from January to July 2026.
The overall penetration rate of NEVs in the world is showing a rapid upward trend. It has reached 13.1% in 2022, 15.9% in 2023, 19.5% in 2024, 23.6% in 2025, and 24.1% in 2026. Among them, Germany reached 32.6%, Norway reached 81%, the United Kingdom 35%, while the US was only 7% and Japan was only 4%, so the imbalance in the world's NEV development is extremely obvious.
In 2025, the world share of new energy passenger vehicles in China was 68.3%; from January to July 2026, the world share of new energy passenger vehicles reached 62%; in July 2026, it reached a good level of 65.3%. In 2025, China's share of plug-in hybrids in the world reached a high level of 76.4%; in 2026, China's share of plug-in hybrids reached a high level of 71%; in July, it reached 74%, and in July, China showed excellent performance in the world plug-in hybrid market.
In 2025, the overseas market sales share of autonomous new energy passenger vehicles reached 15.8%, a significant increase. In 2026, the overseas market sales share of autonomous new energy passenger vehicles increased dramatically, reaching 28% in July, a further sharp jump.
I. Global NEV trends
1. World NEV performance in 2026
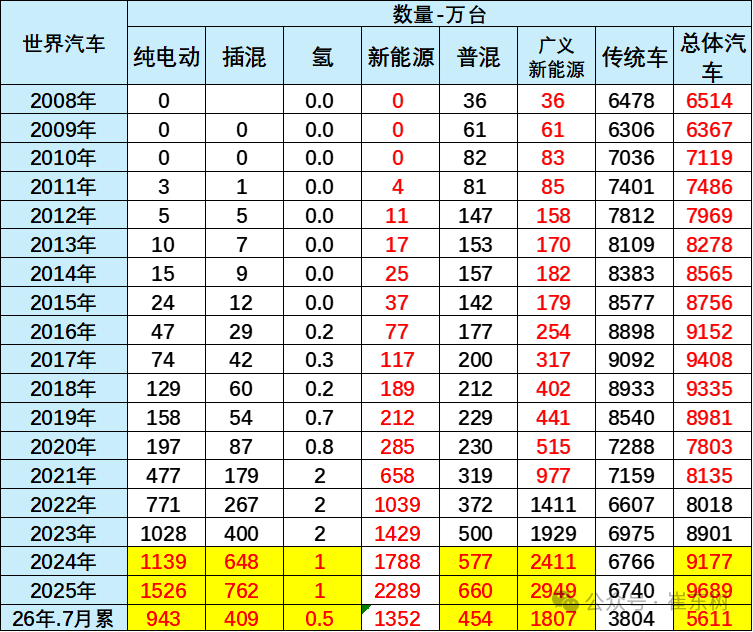
In 2024, the world sold 91.77 million units of automobiles, of which 17.88 million new energy vehicles were sold, and fuel vehicles accounted for a relative decline. In 2025, world automobile sales will reach 96.89 million units, and new energy vehicles will reach 22.89 million units.
From January to July 2026, world automobile sales reached 56.11 million units, and new energy vehicles reached 13.52 million units. From January to July 2026, ordinary hybrids surpassed plug-in hybrids as a growth highlight.
2. World automobile energy structure
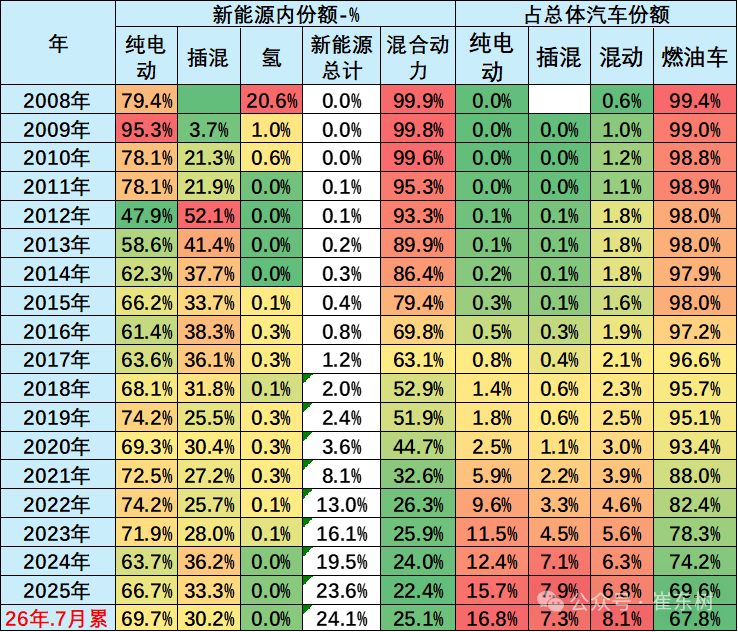
In 2025, the global NEV sales ratio reached 30% of the world's automobile sales, an increase of 4 percentage points over the full year of 2024, while NEVs in the narrow sense reached 23.6%, showing a relatively strong state.
From January to July 2026, the share of new energy vehicles reached 24.1%, of which pure electric vehicles accounted for 16.8%, and plug-in hybrid vehicles reached 7.3%. The hybrid achieved excellent performance of 8.1%.
II. Trends in the world's new energy passenger vehicles
1. Trends in the world's new energy passenger vehicle market
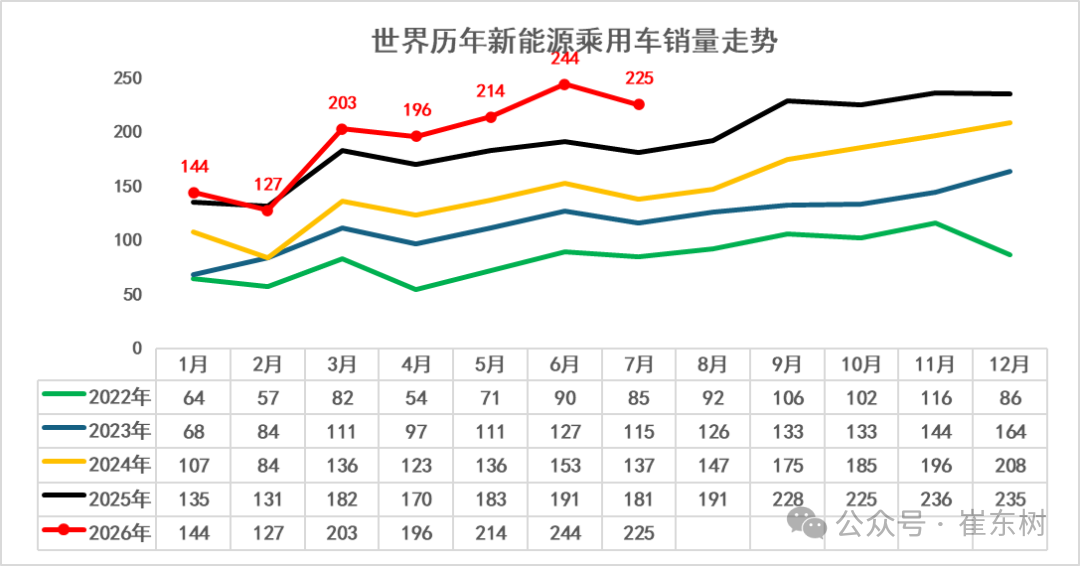
From 2022 to 2024, the world's new energy vehicles showed an accelerated upward trend, and growth was stronger at a low base. The world's new energy vehicles started low in 2025, then resumed high growth in February-September.
Strong growth trend in global NEV passenger vehicle sales from 2022 to 2026: the overall scale continued to expand, with monthly sales exceeding 2.3 million units in 2025, nearly doubling from 2022; continued high growth in the first 7 months of 2026, with a significant year-on-year increase in May-July.
2. World New Energy Passenger Vehicle Performance

Sales of new energy passenger vehicles reached 2.87 million units in 2020, and the trend increased by 42% compared with the same period in 2019. Sales of new energy passenger vehicles reached 6.37 million units in 2021, a strong performance that exceeded expectations by 122%.
The trend of new energy passenger vehicles in the world was strong in 2022, reaching 10.5 million units for the whole year, an increase of 65% over the previous year. The trend of new energy passenger vehicles in the world was strong in 2023, reaching 14.12 million units for the whole year, an increase of 34% over the previous year.
In 2024, the world's new energy passenger vehicles reached 17.88 million, an increase of 27% over the previous year. Because of the slowdown in the European and American energy trends, the world's new energy has slowed significantly compared to previous years. In 2025, the world's new energy passenger vehicles reached 22.89 million, an increase of 28% over the previous year.
From January to July 2026, the world's new energy passenger vehicles reached 13.52 million units, an increase of 15% over the previous year. Of these, sales of new energy vehicles increased by 24% to 2.25 million units in July, and the growth rate returned to normal historical levels.
3. Overseas NEV passenger vehicle market trends
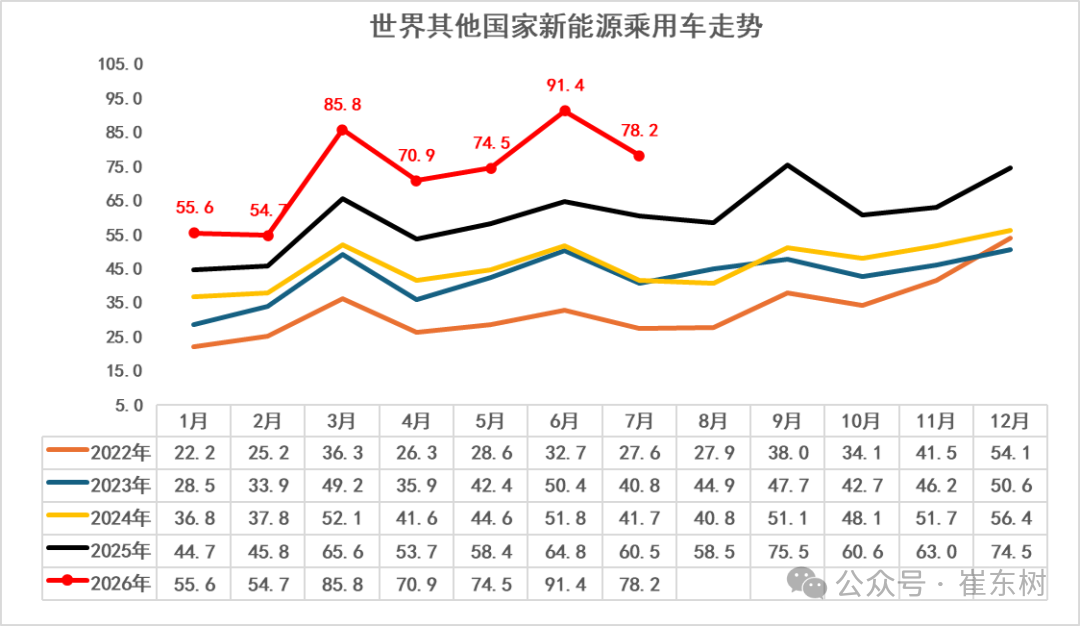
Overseas trends in July of this year were relatively volatile, which is characterized by the fragmentation of trends in overseas new energy markets. Due to the large European NEV market, the overall performance of overseas NEVs is relatively good.
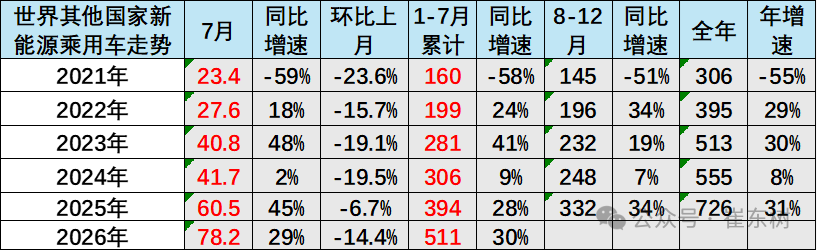
The overall trend of new energy in markets outside of China is growing abnormally. The trend of new energy in the US has fluctuated sharply recently. As a result, sales of new energy vehicles in other countries overseas increased 29% by 780,000 units in July; overseas NEV sales in January-July reached 5.11 million units, and the growth rate reached 30%, which is close to the average of the previous two years.
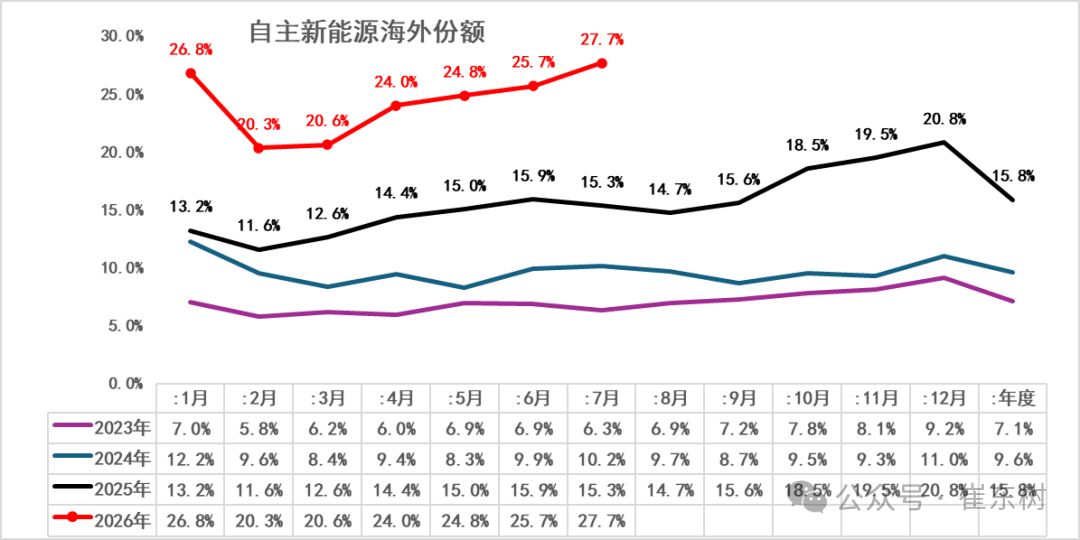
Currently, in mainstream markets that can be counted overseas, the overall performance of independent brands of new energy products in overseas market analysis continues to strengthen. In 2023, China's own-brand NEVs had 7.1% overseas market share; in 2024, the overseas sales share of autonomous new energy passenger vehicles was 9.6%, an increase of 2.5 points. In 2025, the overseas market sales share of autonomous new energy passenger vehicles reached 15.8%, a significant increase. In 2026, the overseas market sales share of autonomous new energy passenger vehicles increased dramatically, reaching 28% in July, a further sharp jump.
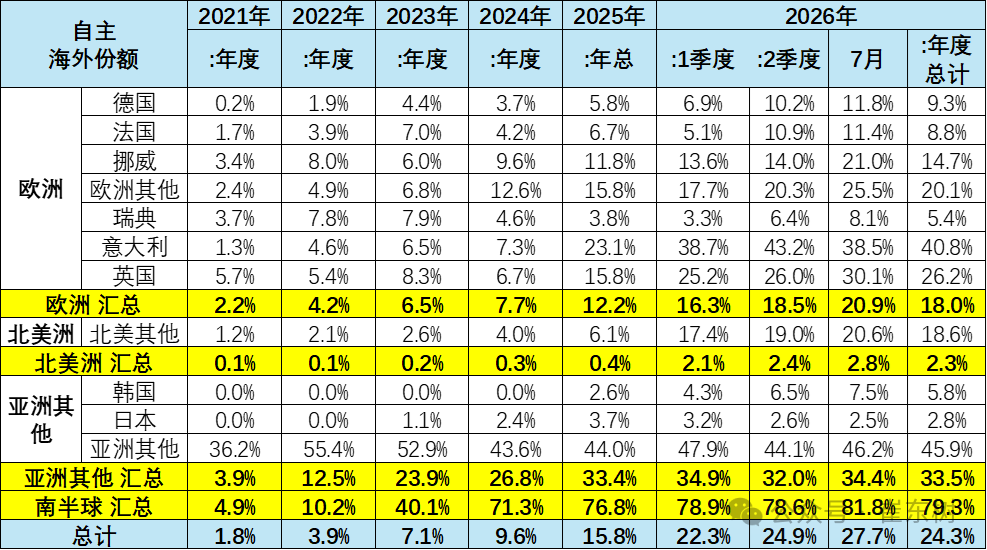
From January to July 2026, the overseas sales share of autonomous new energy passenger vehicles was 24%, up 10 percentage points from the same period in 2025. Due to the good performance of autonomous new energy exports, and the severe contraction of the US NEV market, the sales share of autonomous NEV passenger vehicles in overseas markets has increased significantly. Currently, the share of new energy in South America exceeds 80%, and the share of new energy in Southeast Asia has reached 46%.
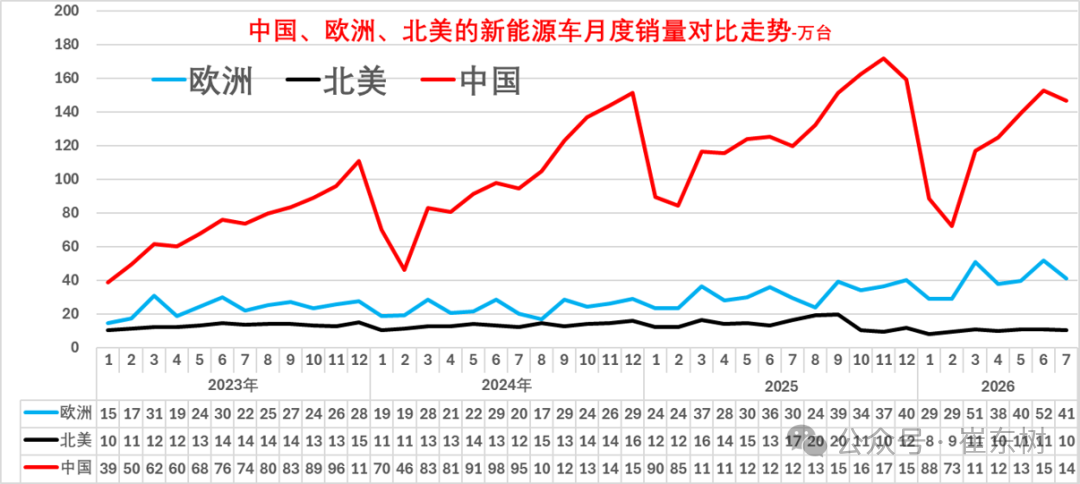
Judging from regional market trends for new energy vehicles, Europe surpassed China in 2020. The European NEV market grew steadily at an overall high level from 2021 to 2026, while China's NEV market has continued to trend strongly in recent years.
China's slump in January-July of this year is temporary, but the US energy trend is far weaker than China's.
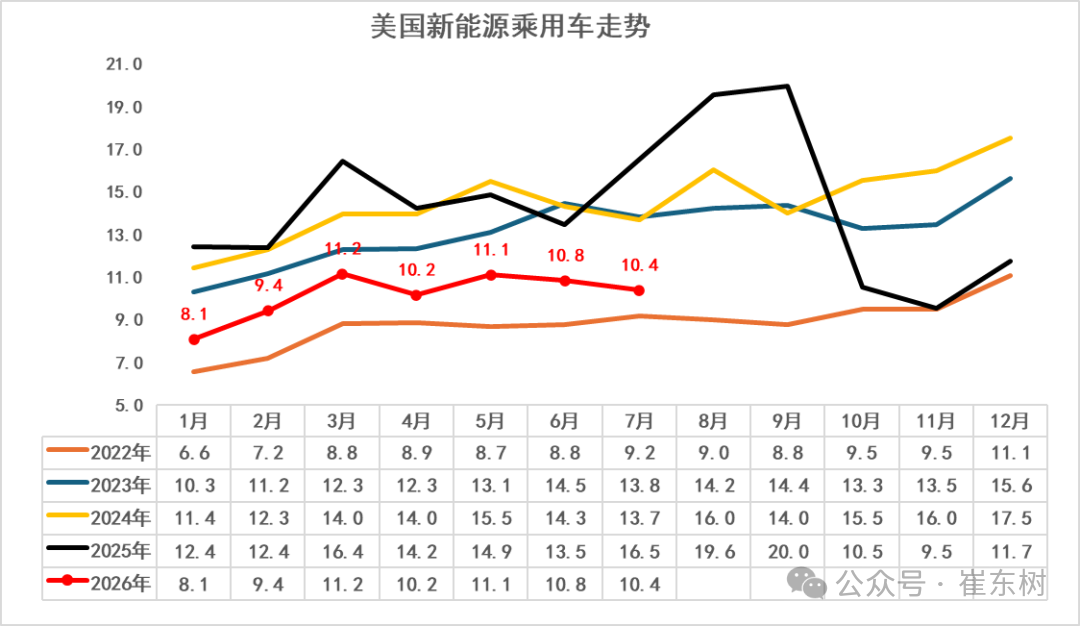
New energy passenger cars in the US weakened after October 2025. Early experimenters and environmentalists in Europe and the US have already purchased electric vehicles. The US government has lifted subsidies for new energy vehicles, which has had a great impact on new energy in the US. Even if Tesla liberalizes the use of autonomous driving, the increase in sales penetration rate has not met expectations.
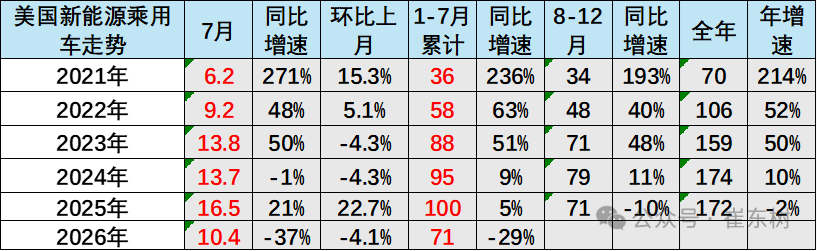
In 2025, sales of new energy in the US fell 2% to 1.72 million units, which is lower than the growth rate in recent years. Due to price increases due to high tariffs and the cancellation of new energy subsidies, US NEV sales fell 37% year on year in July 2026, and US NEV sales fell 29% by 710,000 units in January-July.
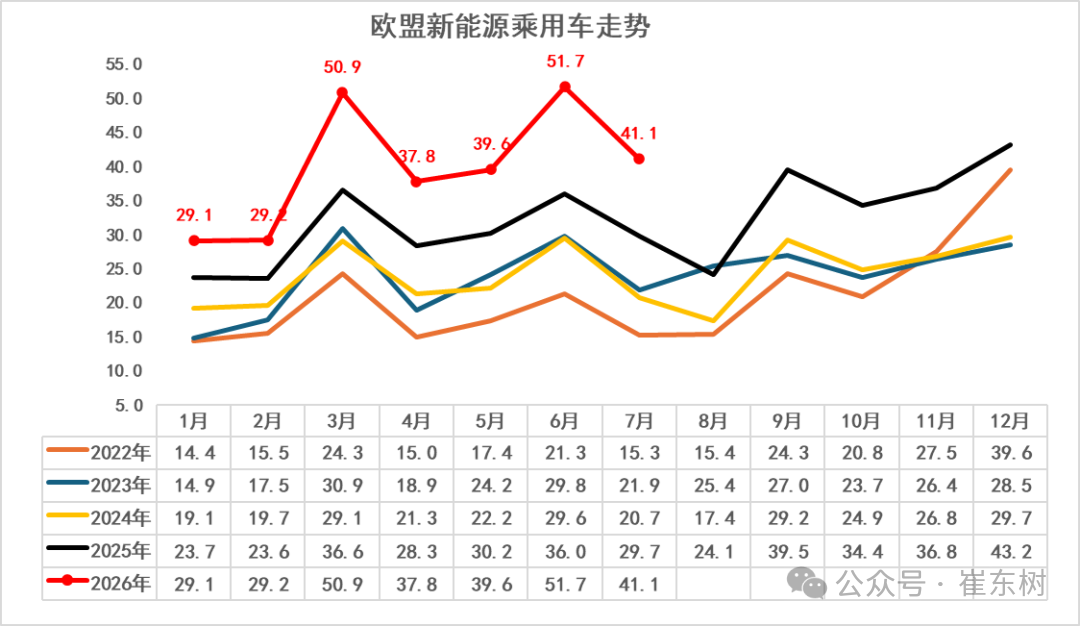
Sales of new energy vehicles in Europe were relatively low in July of previous years. The market declined sequentially this year. Currently, against the backdrop of a sluggish European economy and consumption, European NEVs are still growing significantly.
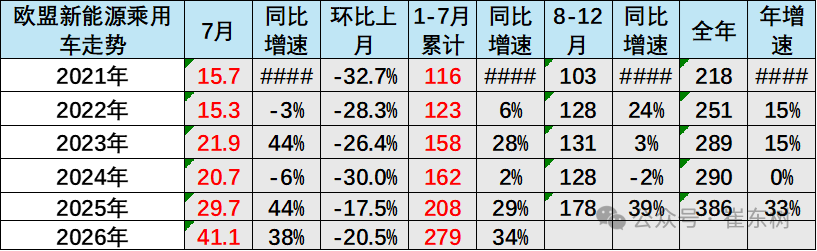
European new energy passenger vehicles sold 3.86 million units in 2025, an increase of 960,000 units over the same period last year, an increase of 33%. According to preliminary statistics, Europe's 410,000 new energy passenger vehicles increased 38% year on year in July, and 2.79 million units increased 34% year on year from January to July 2026.
4. New energy penetration rate in countries around the world
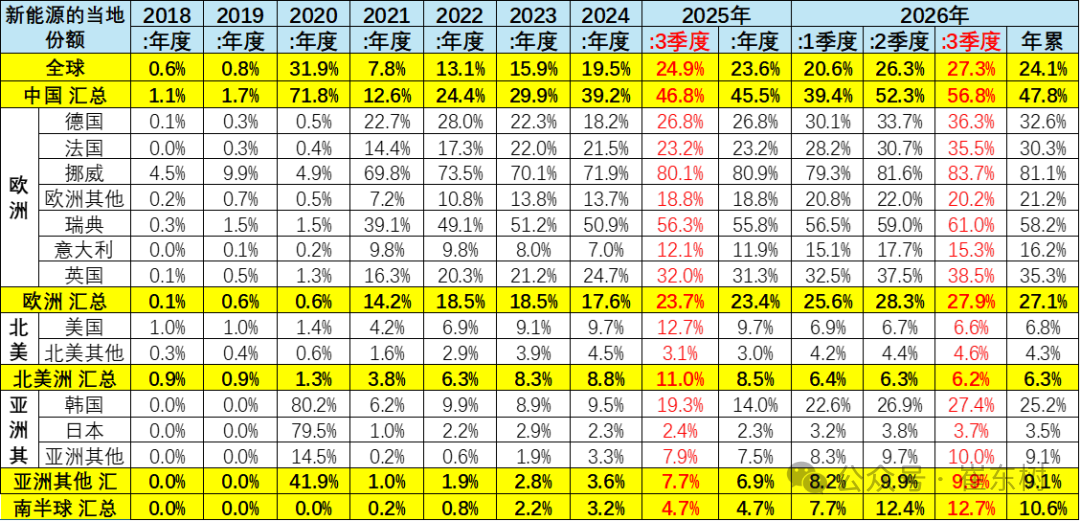
The overall penetration rate of NEVs in the world is showing a rapid upward trend. It has reached 13.1% in 2022, 15.9% in 2023, 19.5% in 2024, 23.6% in 2025, and 24.1% in 2026. Among them, Germany reached 32.6%, Norway reached 81%, the United Kingdom 35%, while the US was only 7% and Japan was only 4%, so the imbalance in the world's NEV development is extremely obvious.
As China continues to strengthen the development of new energy sources, the US is weakening its incentive policy for new energy sources. New energy subsidies in Europe are gradually being restarted, and the world's new energy vehicles have entered a new stage of differentiated development.
III. Structural characteristics of the world's new energy passenger vehicles
1. Trends in the world's new energy passenger vehicle market
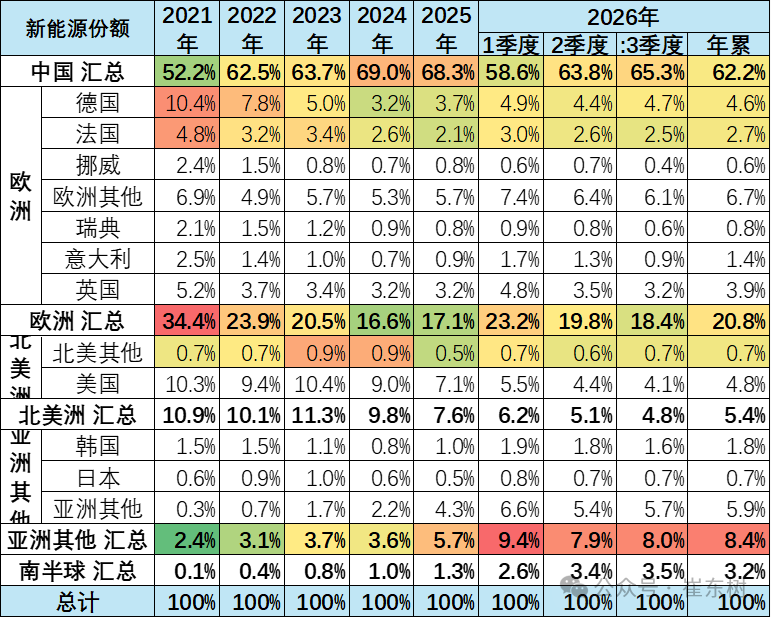
The European new energy market throughout 2021 was affected by the epidemic, and the growth of new energy sources was weak. 2022 is still affected by the pandemic. Europe's share in 2022 fell significantly from 2021, and Europe's share continued to decline slightly in 2023-2024. The world share of new energy in Europe reached 17% in 2025, and the world share of new energy in Europe reached 21% from January to July 2026, a significant increase from the same period last year.
Recently, the growth rate of China's new energy passenger vehicles is stronger than the world average growth rate. In 2020, the world share of new energy passenger vehicles in China reversed significantly. In 2021, China maintained a strong level of 52%; in 2022, China's share of NEVs in the world exceeded 62%; in 2023, China accounted for 64% of the world share; in 2024, it continued to sprint to 69%; in 2025, China's share of NEVs in the world reached 68.3%; from January to July 2026, the world share of new energy passenger vehicles reached 62%, and reached a good level of 65.3% in July 2026.
2. New energy vehicle share trends among manufacturers
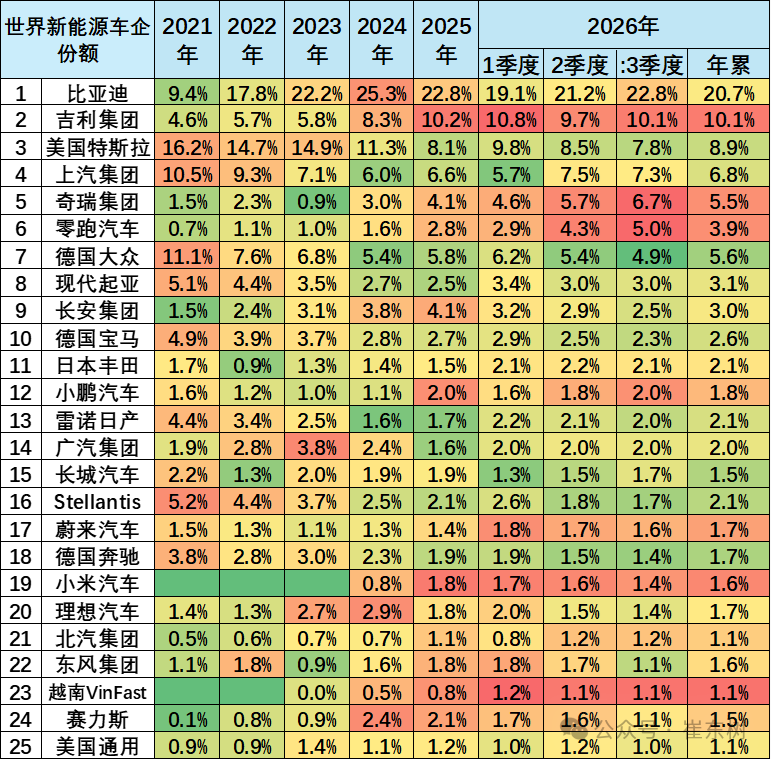
Judging from the sales share over the years, China's BYD is leading the world, Geely is rapidly rising, and Tesla's performance is poor, and it has fallen to third place. Recently, two autonomous vehicle companies, SAIC Motor Group Passenger Car and SAIC Wuling, have performed well overseas.
Geely Automobile and Chery New Energy have strengthened significantly recently. The performance of German Volkswagen's new energy vehicles was relatively stable, and the BMW Group, Korea Hyundai, etc. dropped to the third-tier level.
Competition in the new energy wave for luxury cars is relatively intense, and Tesla's performance in the US is slowing down. Currently, the trend of BMW and Mercedes-Benz is average.
IV. Market trends of pure electric new energy vehicle structures
1. Pure electric world structure
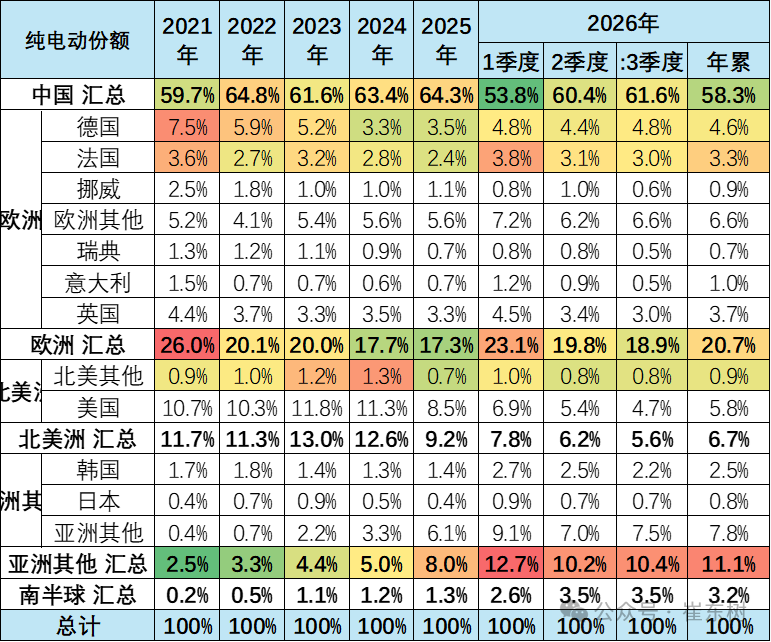
China's share performance in the global pure electric vehicle market is relatively stable, with a share of around 63% from 2023 to 2025.
The share of pure electric vehicles in Europe fell from 26% in 2021 to 20% in 2023, and the share fell relatively to 21% in January-July 2026. The share of electric vehicles in the US was only 8.5% in 2025, while the 6.0% performance in January-July 2026 declined significantly.
2. Trends in car companies' share
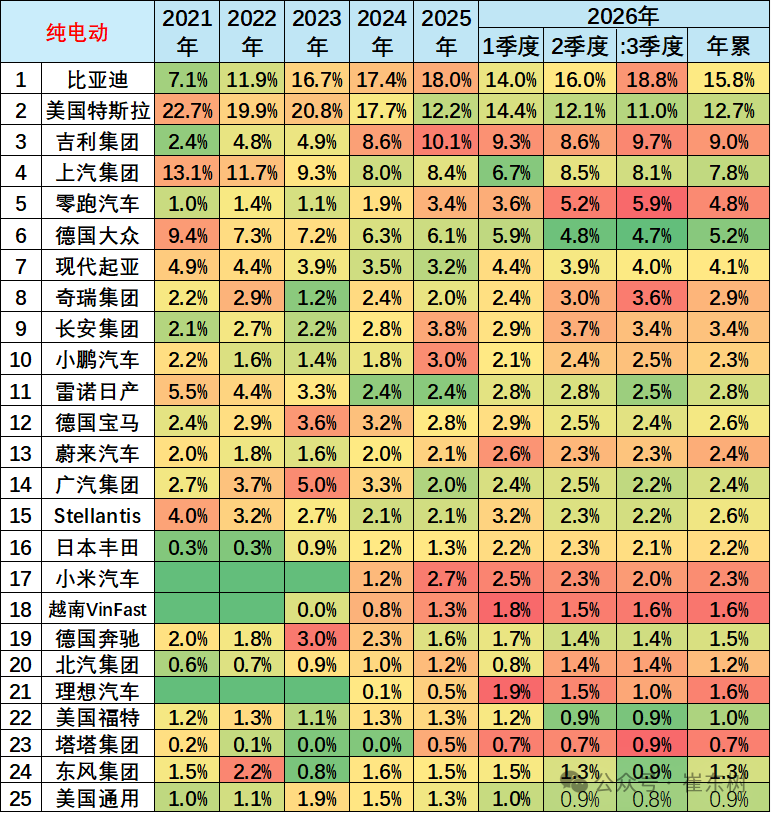
Judging from the pure electric share of car companies, BYD's share continues to rise overall. From the 7% share level in 2021, the share rose to 17% in 2023, and the 2024-2025 share reached 18%, which performed well.
Tesla's share performance among pure electric vehicles is relatively poor. Tesla's share level of around 23% in 2021 has remained low at 13%.
Geely Group's share rose from 4% in 2019 to 9% in 2026. SAIC Motor's share of pure electric power has been strong recently, and GAC Group and Changan pure electric have been relatively stable.
5. Market trends in plug-in hybrid new energy vehicle structures
1. Mixed world structure
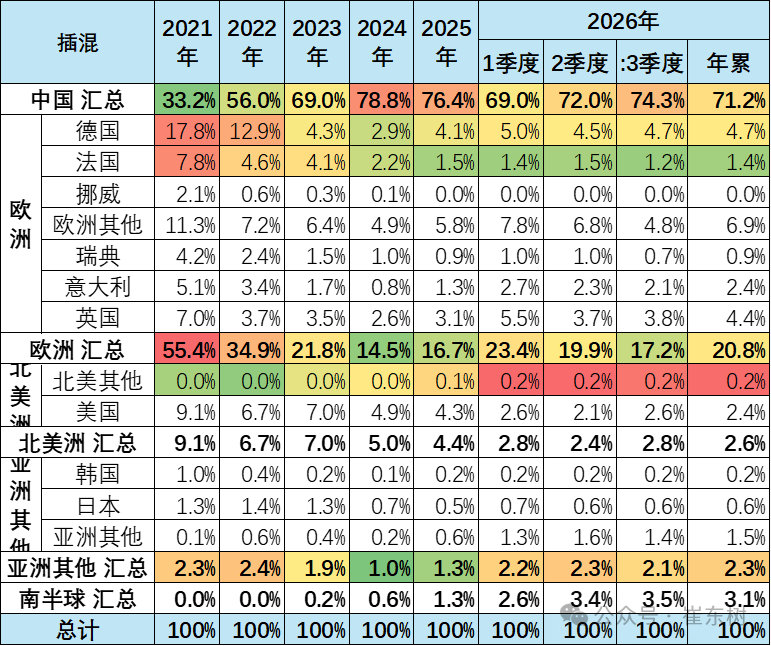
China is far ahead in terms of the share of plug-in hybrids in the world. In 2021, China's share of plug-in hybrids in the world was 33%; in 2025, China's share of plug-in hybrids in the world reached a high level of 76.4%; in 2026, China's share of plug-in hybrids in the world reached a high level of 71%. In July, it reached 74%, and in July, China showed excellent performance in the world plug-in hybrid market.
Europe's share of plug-in hybrids fell from 55% in 2021 to 21% in 2026.
2. Trends in car companies' share
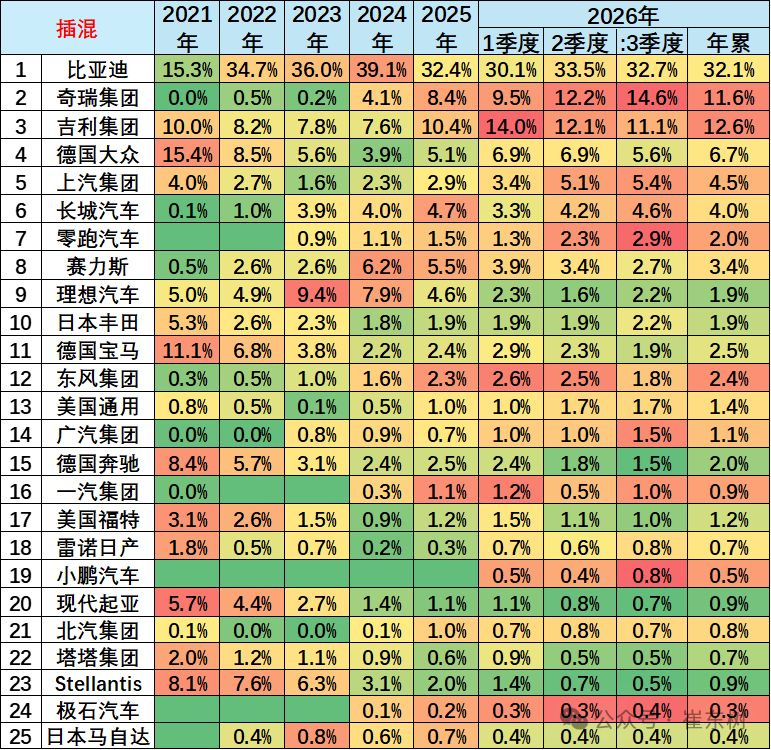
Judging from the car companies' share of plug-in hybrids, BYD had the most outstanding performance. BYD's share of plug-in hybrids in the world was 15% in 2021, rising to 36% of the world's plug-in hybrid share in 2023. In 2024, BYD's share of 39% was very good. This year's share remained at 32% in January-July, reflecting BYD's leading performance in the plug-in hybrid market.
German Volkswagen's share of plug-in hybrids rose sharply to 15% in 2021, then fell to a rock bottom in 2024, and then rose back to 6.7% in 2026. BMW's share of plug-in hybrids then fell to the bottom in 2024, then rose back to 2.5% in 2026. Geely Volvo's plug-in hybrids account for 12.6% of the world's level.
6. Hybrid vehicle structure market trends
1. The mixed world structure
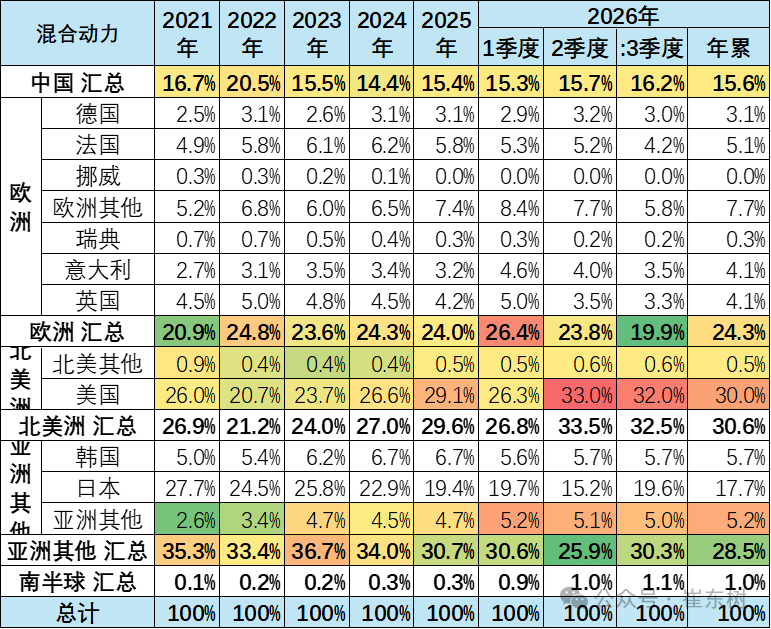
China's hybrid developed rapidly in the first two years, and in 2022 it became the world's largest hybrid market. With the rise of plug-in hybrids, China's share of hybrid power in the world has declined since 2023, but in 2026, China's hybrid share will rise to 15.6% of the world.
The hybrid market in the US has rebounded significantly since 2024. From 2026 to now, the US's hybrid market accounts for 30% of the global market.
2. The share trend of mixed enterprises
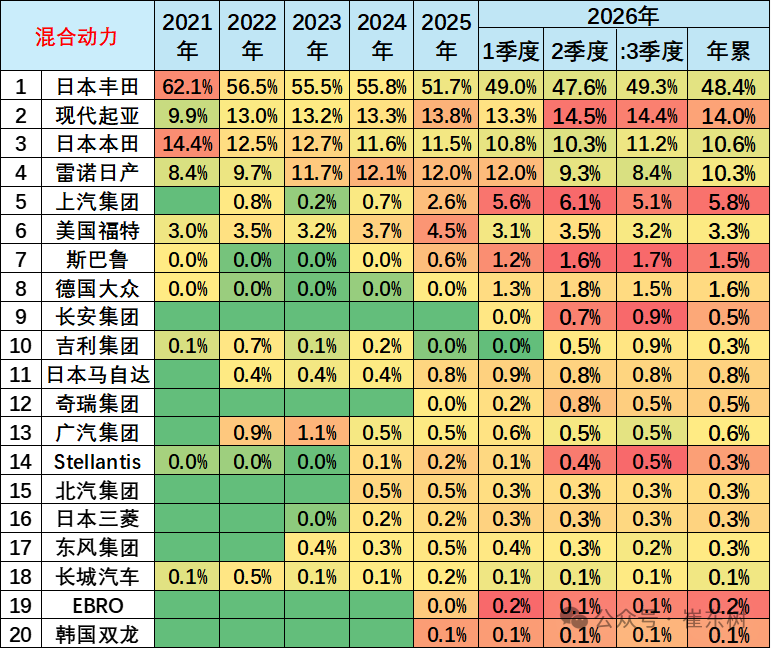
The hybrid market is strongly dominated by Japan and South Korea. The hybrid performance of Toyota, Honda, Nissan, and Hyundai is strong, accounting for 84% in 2026.
Most other companies have a mixed share of less than 1%. Recently, Ford and Mazda have performed well in the hybrid market share in the US.