
Asian Market's Hidden Gems: 3 Stocks Priced Below Estimated Value
In recent weeks, Asian markets have experienced a mix of resilience and volatility, with technology and semiconductor stocks showing notable activity amid global economic shifts. As investors navigate these fluctuations, identifying undervalued stocks can offer potential opportunities for those looking to capitalize on discrepancies between market price and estimated value.
Top 10 Undervalued Stocks Based On Cash Flows In Asia
| Name | Current Price | Fair Value (Est) | Discount (Est) |
| Yageo (TWSE:2327) | NT$568.00 | NT$1125.57 | 49.5% |
| Winbond Electronics (TWSE:2344) | NT$176.00 | NT$348.89 | 49.6% |
| SILICON2 (KOSDAQ:A257720) | ₩51900.00 | ₩103326.49 | 49.8% |
| Shanghai Chicmax Cosmetic (SEHK:2145) | HK$22.30 | HK$43.82 | 49.1% |
| Sansha Electric ManufacturingLtd (TSE:6882) | ¥1165.00 | ¥2311.06 | 49.6% |
| Mao Geping Cosmetics (SEHK:1318) | HK$49.74 | HK$97.85 | 49.2% |
| gremsInc (TSE:3150) | ¥2462.00 | ¥4914.62 | 49.9% |
| Akeso (SEHK:9926) | HK$85.65 | HK$170.69 | 49.8% |
| Air Water (TSE:4088) | ¥2703.00 | ¥5387.29 | 49.8% |
| Acotec Scientific Holdings (SEHK:6669) | HK$6.32 | HK$12.52 | 49.5% |
We're going to check out a few of the best picks from our screener tool.
Jiangsu Azure (SZSE:002245)
Overview: Jiangsu Azure Corporation operates in the lithium batteries, LED chips, and metal logistics and distribution sectors both in China and internationally, with a market cap of CN¥30.61 billion.
Operations: The company's revenue is primarily derived from its lithium battery segment at CN¥4.53 billion, followed by metal logistics at CN¥2.78 billion, and LED epitaxial wafers and chips at CN¥1.59 billion.
Estimated Discount To Fair Value: 42.8%
Jiangsu Azure appears undervalued based on cash flow analysis, trading at CN¥17.9, significantly below its estimated future cash flow value of CN¥31.29. Recent earnings show strong growth with net income rising to CN¥510.97 million from CN¥333.12 million year-over-year, driven by increased sales and revenue figures. Despite high share price volatility recently, the company's earnings are expected to grow significantly at 29.6% annually over the next three years, outpacing the broader Chinese market growth rate.
- Our earnings growth report unveils the potential for significant increases in Jiangsu Azure's future results.
- Click here to discover the nuances of Jiangsu Azure with our detailed financial health report.
Zhejiang Meili High Technology (SZSE:300611)
Overview: Zhejiang Meili High Technology Co., Ltd. is involved in the research, development, production, and sale of high-end spring products both in China and internationally, with a market cap of CN¥5.60 billion.
Operations: Zhejiang Meili High Technology Co., Ltd. generates revenue through its focus on high-end spring products for both domestic and international markets.
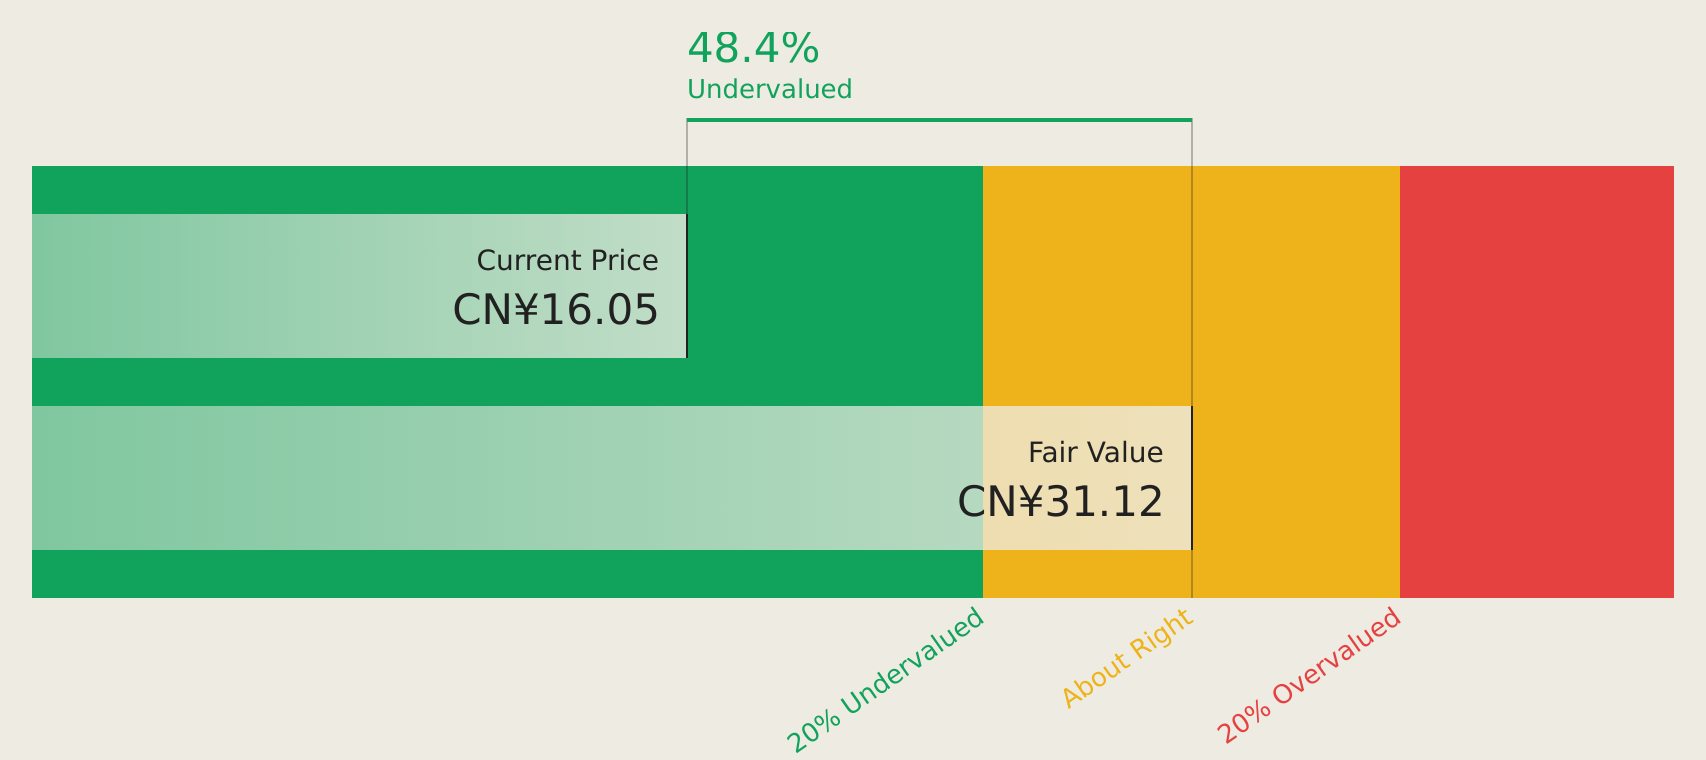
Estimated Discount To Fair Value: 42.4%
Zhejiang Meili High Technology is trading at CN¥26.52, substantially below its estimated future cash flow value of CN¥46.07, highlighting its undervaluation. Recent earnings for the first half of 2026 show net income growth to CNY 116.47 million from CNY 80.4 million year-over-year, with revenue forecasted to grow faster than the Chinese market at 20.4% annually. However, debt coverage by operating cash flow remains a concern despite strong profit growth projections of 26.84% per year.
- Our expertly prepared growth report on Zhejiang Meili High Technology implies its future financial outlook may be stronger than recent results.
- Click here and access our complete balance sheet health report to understand the dynamics of Zhejiang Meili High Technology.
Tripod Technology (TWSE:3044)
Overview: Tripod Technology Corporation processes, manufactures, and sells printed circuit boards and related components across several countries including Taiwan, China, and Vietnam, with a market cap of NT$264.38 billion.
Operations: The company generates revenue from its Printed Circuit Board segment, which amounts to NT$83.94 billion.
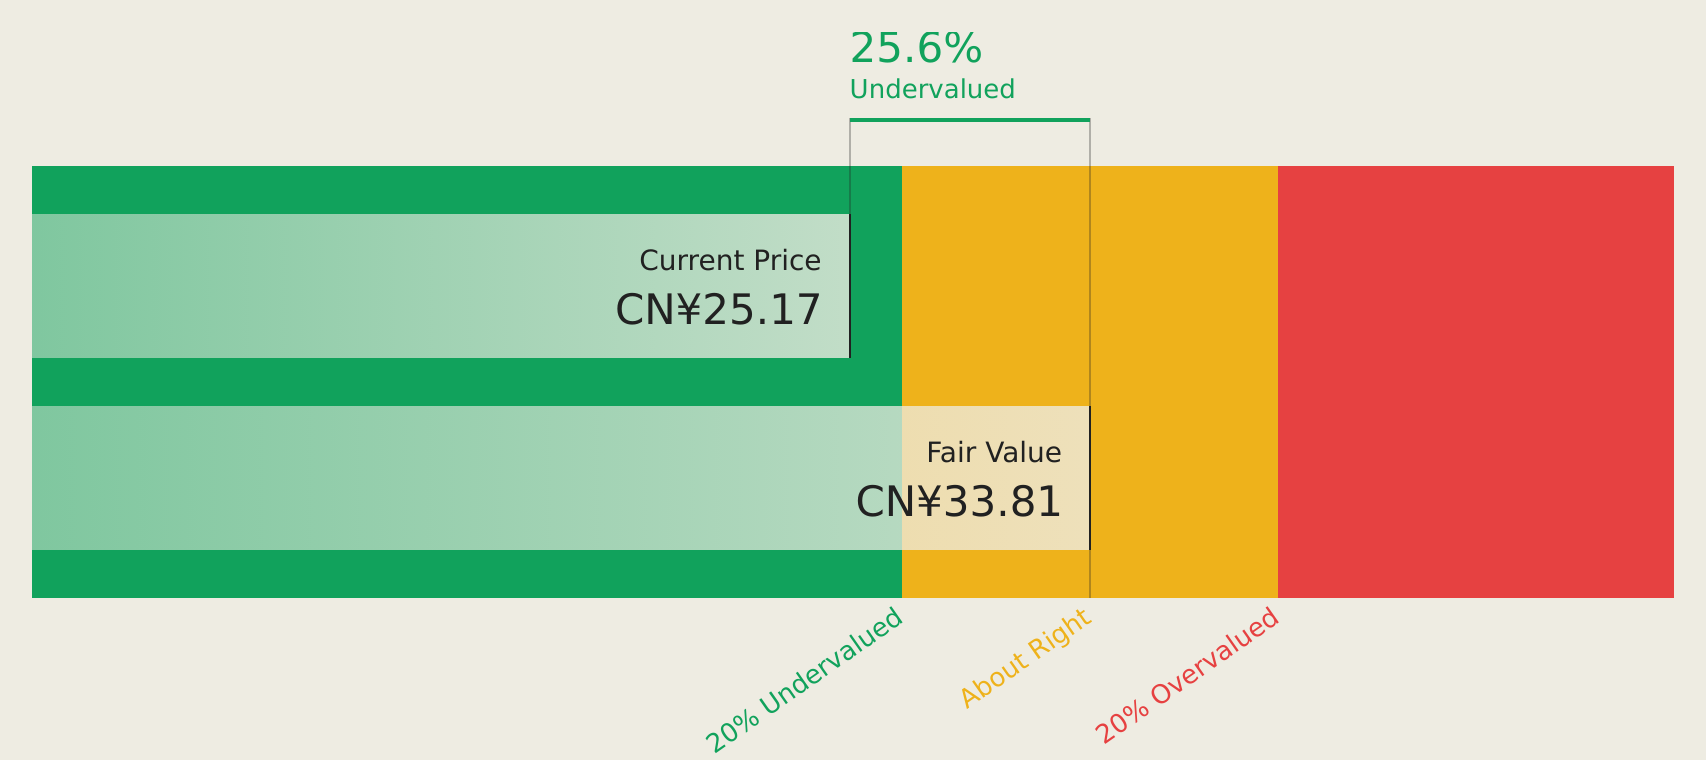
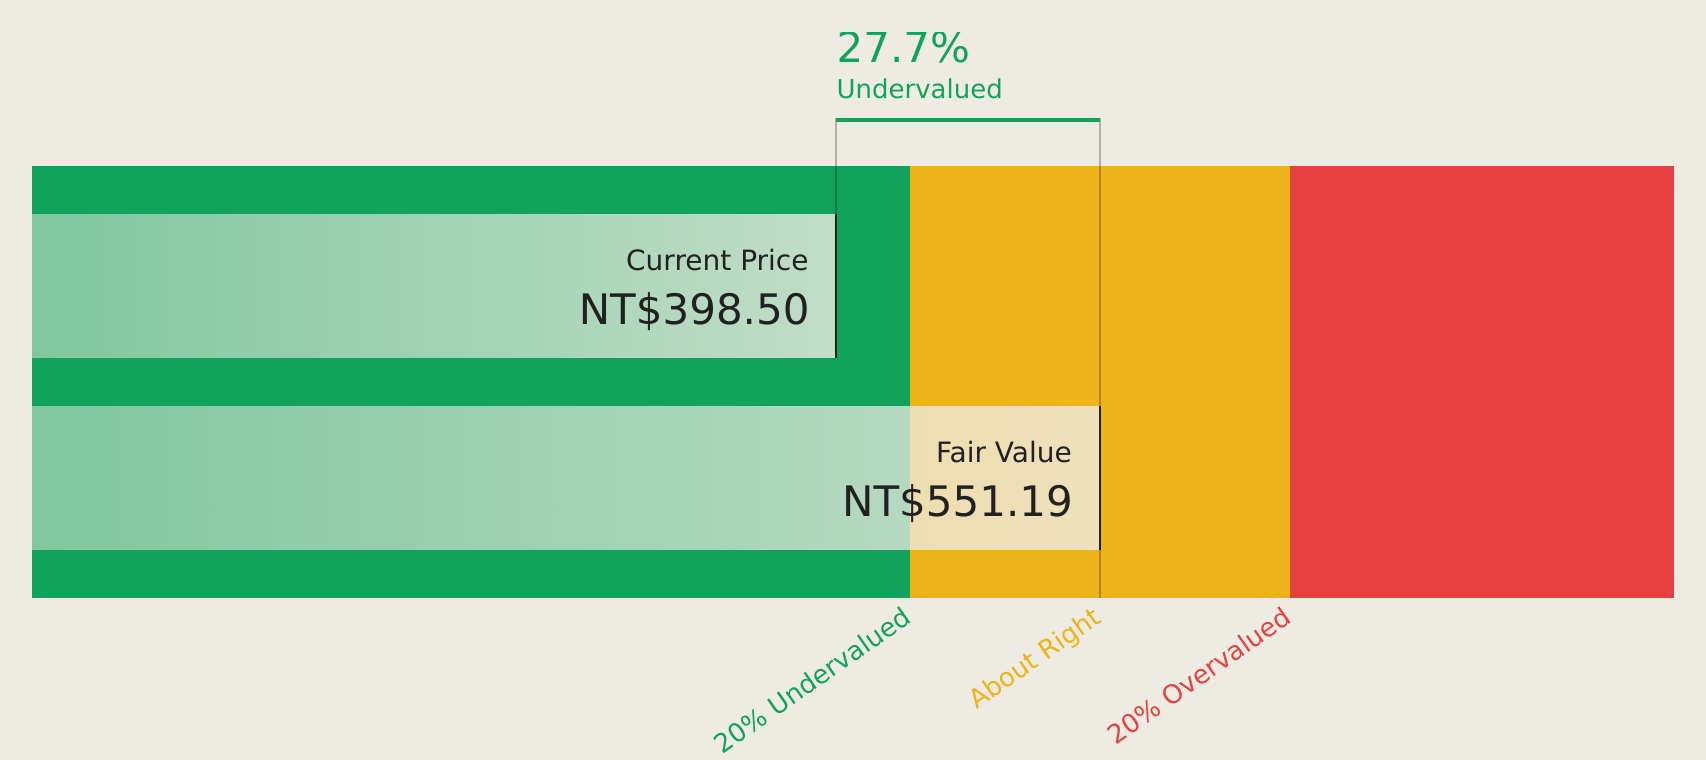
Estimated Discount To Fair Value: 12.6%
Tripod Technology is trading at NT$503, slightly below its estimated future cash flow value of NT$575.22, indicating modest undervaluation. Recent earnings show a rise in net income to TWD 3.9 billion for Q2 2026 from TWD 2.44 billion year-over-year, with earnings growth outpacing the Taiwan market at 29.4% annually. Despite high-quality earnings and strong return on equity forecasts, dividend coverage by free cash flows remains insufficient while revenue growth lags behind market expectations.
- Upon reviewing our latest growth report, Tripod Technology's projected financial performance appears quite optimistic.
- Dive into the specifics of Tripod Technology here with our thorough financial health report.
Where To Now?
- Unlock more gems! Our Undervalued Asian Stocks Based On Cash Flows screener has unearthed 205 more companies for you to explore.Click here to unveil our expertly curated list of 208 Undervalued Asian Stocks Based On Cash Flows.
- Have a stake in these businesses? Integrate your holdings into Simply Wall St's portfolio for notifications and detailed stock reports.
- Unlock the power of informed investing with Simply Wall St, your free guide to navigating stock markets worldwide.
Looking For Alternative Opportunities?
- Explore high-performing small cap companies that haven't yet garnered significant analyst attention.
- Diversify your portfolio with solid dividend payers offering reliable income streams to weather potential market turbulence.
- Fuel your portfolio with companies showing strong growth potential, backed by optimistic outlooks both from analysts and management.
This article by Simply Wall St is general in nature. We provide commentary based on historical data and analyst forecasts only using an unbiased methodology and our articles are not intended to be financial advice. It does not constitute a recommendation to buy or sell any stock, and does not take account of your objectives, or your financial situation. We aim to bring you long-term focused analysis driven by fundamental data. Note that our analysis may not factor in the latest price-sensitive company announcements or qualitative material. Simply Wall St has no position in any stocks mentioned.
Have feedback on this article? Concerned about the content? Get in touch with us directly. Alternatively, email editorial-team@simplywallst.com