
Barrick Mining (TSX:ABX) Shares Climbed, What Is Behind The Latest Attention?
Barrick Mining (TSX:ABX) is back in focus after an agreement with Newmont and progress toward an IPO of its North American gold assets, developments that tie directly into cash flow expectations and valuation.
At a share price of CA$61.11, Barrick Mining has seen short term volatility, with a 7 day share price return down 6.23%, while the 30 day share price return of 18.78% and a 1 year total shareholder return of 66.68% indicate growing investor interest related to the Newmont agreement and planned IPO.
Compare Barrick Mining's momentum and valuation reset with other producers by scanning our hand picked 35 elite gold producer stocks now benefiting from similar sector tailwinds.
The recent rally and ongoing IPO plans leave Barrick Mining trading below several intrinsic and analyst estimates. Does that gap reflect an opportunity in the cash flow story, or a fair reset after the latest move?
Most Popular Narrative: 7% Undervalued
At CA$61.11, Barrick Mining trades below the most followed fair value estimate of CA$65.74, which is built on a detailed long term cash flow story.
Significant ongoing expansion of both gold and copper production capacity, particularly at Lumwana and via organic growth at Fourmile and Reko Diq, positions Barrick to capture elevated long-term demand for gold (as a financial hedge during geopolitical uncertainty/inflation) and copper (driven by electrification and infrastructure investment). This is cited as supporting top-line revenue growth over the coming decade.
Curious what underpins that CA$65.74 fair value. The narrative leans on measured revenue growth, slightly softer margins, and a higher future earnings multiple that still sits below the sector.
Result: Fair Value of CA$65.74 (UNDERVALUED)
Have a read of the narrative in full and understand what's behind the forecasts.
However, the Barrick Mining narrative could be challenged if political or ESG setbacks raise costs, or if declining ore grades lift cash costs faster than expected.
Find out about the key risks to this Barrick Mining narrative.
Another View on Barrick Mining's Valuation
The SWS DCF model presents a different perspective on Barrick Mining. At CA$61.11, the stock is trading above an estimated future cash flow value of CA$49.27, which appears overvalued using this approach. Is the cash flow analysis too conservative, or are multiples assigning too much value?
Look into how the SWS DCF model arrives at its fair value.
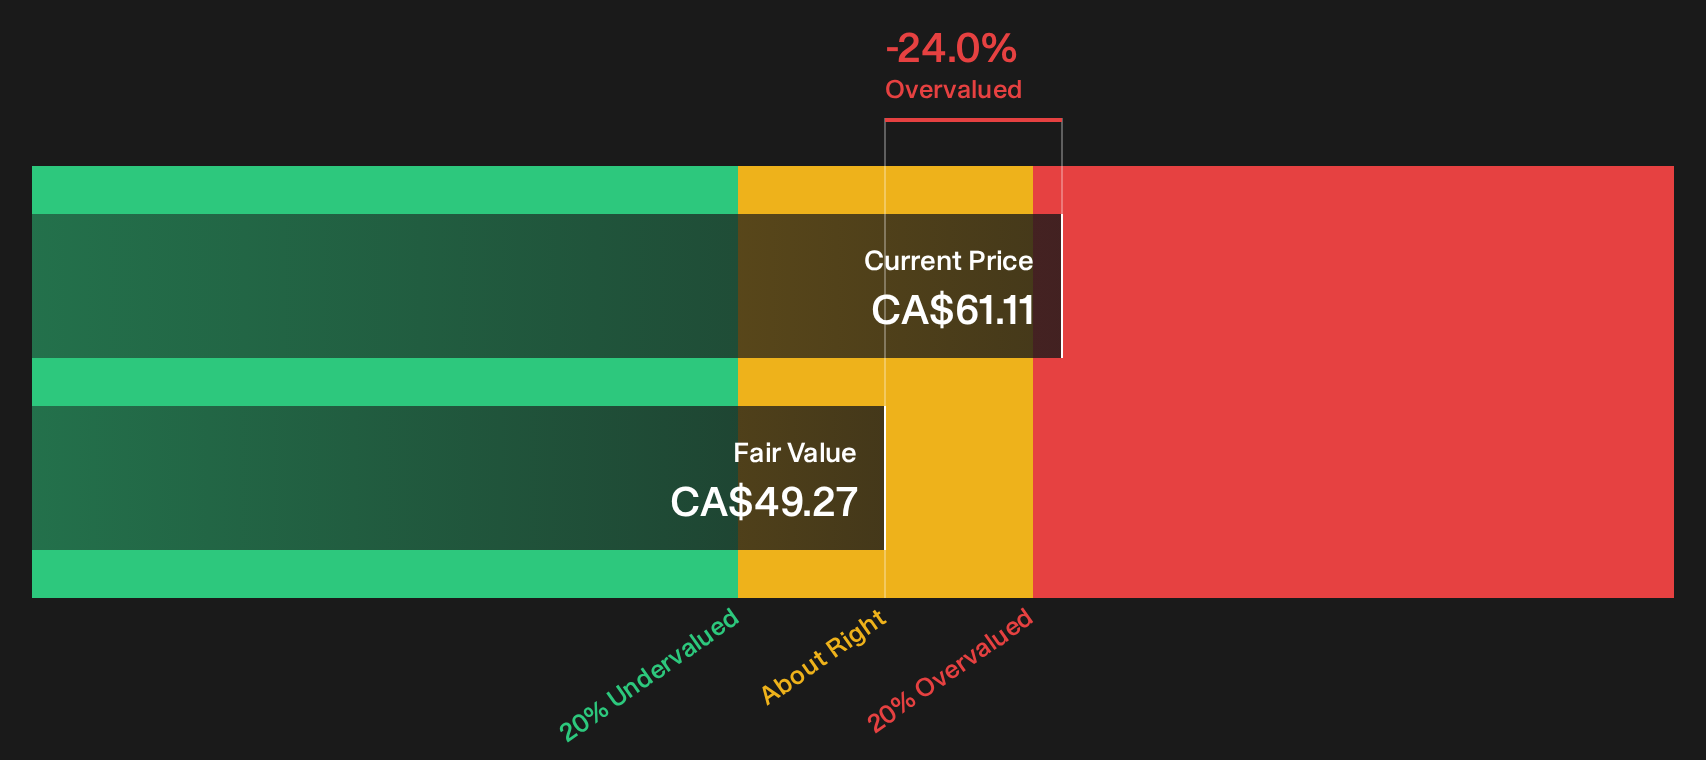
Simply Wall St performs a discounted cash flow (DCF) on every stock in the world every day (check out Barrick Mining for example). We show the entire calculation in full. You can track the result in your watchlist or portfolio and be alerted when this changes, or use our stock screener to discover 14 high quality undervalued stocks. If you save a screener we even alert you when new companies match - so you never miss a potential opportunity.
Next Steps
With mixed signals on Barrick Mining so far, it helps to move fast and test the story against your own view of risk and reward. To weigh both sides in one place, start with the 4 key rewards and 2 important warning signs.
Looking for more investment ideas beyond Barrick Mining?
If Barrick Mining has sharpened your focus, do not stop here. Use the Simply Wall St Screener to spot other opportunities that fit your investing style.
- Target stability and dividends that work harder for you by reviewing the 3 dividend fortresses built to highlight income focused opportunities.
- Hunt for quality at sensible prices by checking the 14 high quality undervalued stocks that filters for strong fundamentals and appealing valuations.
- Protect your downside first by scanning the 11 resilient stocks with low risk scores designed to surface companies with more resilient risk profiles.
This article by Simply Wall St is general in nature. We provide commentary based on historical data and analyst forecasts only using an unbiased methodology and our articles are not intended to be financial advice. It does not constitute a recommendation to buy or sell any stock, and does not take account of your objectives, or your financial situation. We aim to bring you long-term focused analysis driven by fundamental data. Note that our analysis may not factor in the latest price-sensitive company announcements or qualitative material. Simply Wall St has no position in any stocks mentioned.
Have feedback on this article? Concerned about the content? Get in touch with us directly. Alternatively, email editorial-team@simplywallst.com