
“Fast money” is extremely cautious, but instead lays an upward lead: the S&P 500 indicates 8,000 points?
The Zhitong Finance App learned that in the past few months, investors have dealt with market uncertainty with a defensive attitude. However, when prudence became consensus, a counterintuitive situation was taking hold: the real “painful trade” of the market was just rising.
Although the overall position is still in a net long position, the directional risk exposure for “fast money” is at its lowest level since “Liberation Day” in April 2025. According to Goldman Sachs main broker business data, the net leverage ratio of the US long and short strategy fund fell to 47.6% last week, and the long and short ratio was slightly below 1.6. Both indicators are at their lowest levels in the past year. Although there has been an increase in overall exposure, it is only at the 19th percentile in history. Overall, short and hedged positions are growing faster than long positions.
Bobby Molavi, head of executive services at Goldman Sachs Europe, Middle East and Africa, said the current positions are “much cleaner than before.” He believes that part of the bubble has been squeezed out, and the phenomenon of retail investors chasing growth also seems to have abated. “I wouldn't say people's holdings are too low, but compared to June, their holdings are far less crowded. Furthermore, regional/industry rotation and stock price performance in August also seem to have led to some degree of fragmentation.”
The information revealed behind this is worth watching. Prior to major events in August, such as the Jackson Hole Global Central Bank Annual Meeting and Nvidia earnings report, hedge funds were generally unwilling to increase their directional exposure. Now that all of these key points have passed, the results are mixed: Nvidia's performance beyond expectations calmed market confidence in AI transactions, yet monetary policy was repriced in a hawkish manner. The yield on US 10-year Treasury bonds once surpassed 4.8% this week, putting some pressure on the stock market.
The next two weeks will be a critical window, and the possibility that the Federal Reserve will raise interest rates at the September 15-16 meeting is now close to 70%. US non-farm payrolls and inflation data may reinforce existing logic, or completely reverse market narratives. However, in the current context of light positions, if the market rebounds, fund managers may be forced to pursue the upside.
A spike in volatility is no longer an alarm; it could be a buying signal
Surprisingly, large spikes in volatility may no longer be a problem. “An increase is accompanied by a rise in volatility” — this description has been used throughout this year's market reviews, meaning that it usually calms the rise in the market, but instead brings about greater volatility rather than smaller fluctuations.
The data supports the underlying logic behind this phenomenon: Volatility is no longer an early warning sign; instead, it is beginning to act as a buying signal. The specific test method is to select about 150 stock indicators, covering the benchmark index, various industry sectors in the US and Europe, and theme sectors from AI to defense, and observe the market situation when the actual monthly volatility of an indicator suddenly soars to more than 1.5 times its annual average.
Surging volatility is positively correlated with strong performance
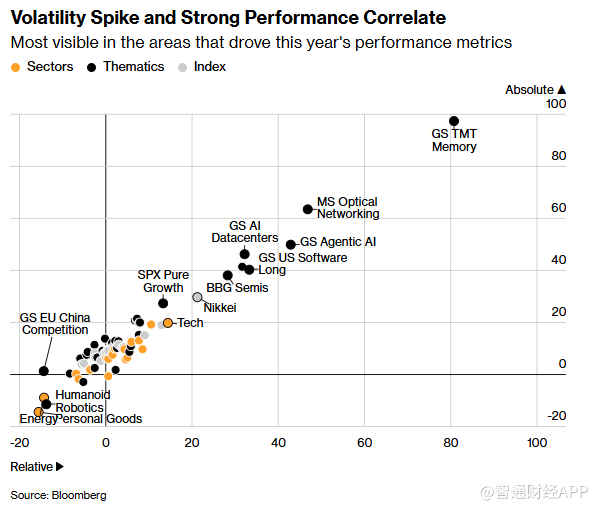
The 2026 results: excellent performance. On average, the indicators that triggered this signal outperformed similar indicators by more than 5 percentage points within the next three months, and about two-thirds of the cases recorded positive returns. This is the best year in terms of data going back over the past ten years.
The sector that triggered this signal also happened to be the main line of the year. After soaring volatility in sectors such as memory chips, optical communications, intelligent AI, and data centers, it achieved excessive increases ranging from 30% to 80%, followed by semiconductor and Bitcoin concept stocks. However, although utilities, energy, real estate, and value stocks also showed increased volatility, they lacked financial support, and ultimately failed to achieve excess returns. This may mean that rising volatility will only be a favorable factor if capital is intended to flow to these areas in the first place.
It is important to note that about half of this year's volatility events focused on the sell-off in late March and the subsequent repair phase. In other words, a significant portion of the excess earnings actually reflects “who rebounded the hardest in that sharp decline.” Volatility spikes triggered by falling prices, and the subsequent returns are even slightly better than in the case triggered by rising prices. This model is both like the depreciation of high-beta stocks and a true reflection of “volatility attracts capital.”
However, the same test reminds us that this model is conditional, not structural. In 2021, the exact same signal gave a sell indicator — the high volatility target then lost 5 percentage points and had a win rate of less than 30%, and the bear market came a year later. Volatility may be a positive sign, or it may suddenly turn negative. However, in a situation where “fast money” positions are generally insufficient, the possibility of bottoming out is still greater.
Technical side: The S&P 500 trend is trending upward, but momentum is beginning to weaken
In the short term, the technical side is still positive. Bank of America technical analyst Paul Ciana said that the S&P 500 continued to verify the August upward breakthrough. However, momentum is weakening, and both RSI and MACD indicators have failed to confirm the validity of recent highs. Seasonal headwinds, uncertainty about the US election, and rising yields all mean that the rebound is entering a more challenging phase. Volatility is likely to increase from September to October, then a new round of upward trend is expected from November to December.
The S&P 500 technical side sends positive signals
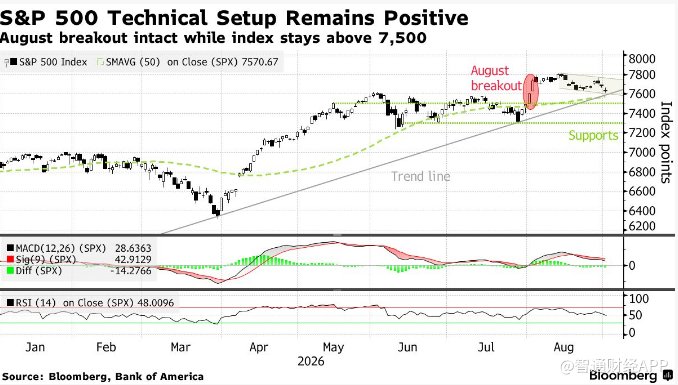
Ciana said, “As long as the S&P 500 index holds 7,500 points, the price trend will remain intact, but rising yields increase the risk of consolidation rather than acceleration.” He believes the target is 8,000 points, 8,234 points, and may even reach 8541 points. “As long as the support level of 7500-7504 points is valid, the trend will continue to lean upward.”