
Weak investment demand in the US and expectations of interest rate hikes “peaked”, making it difficult for Bitcoin to stabilize the $80,000 mark
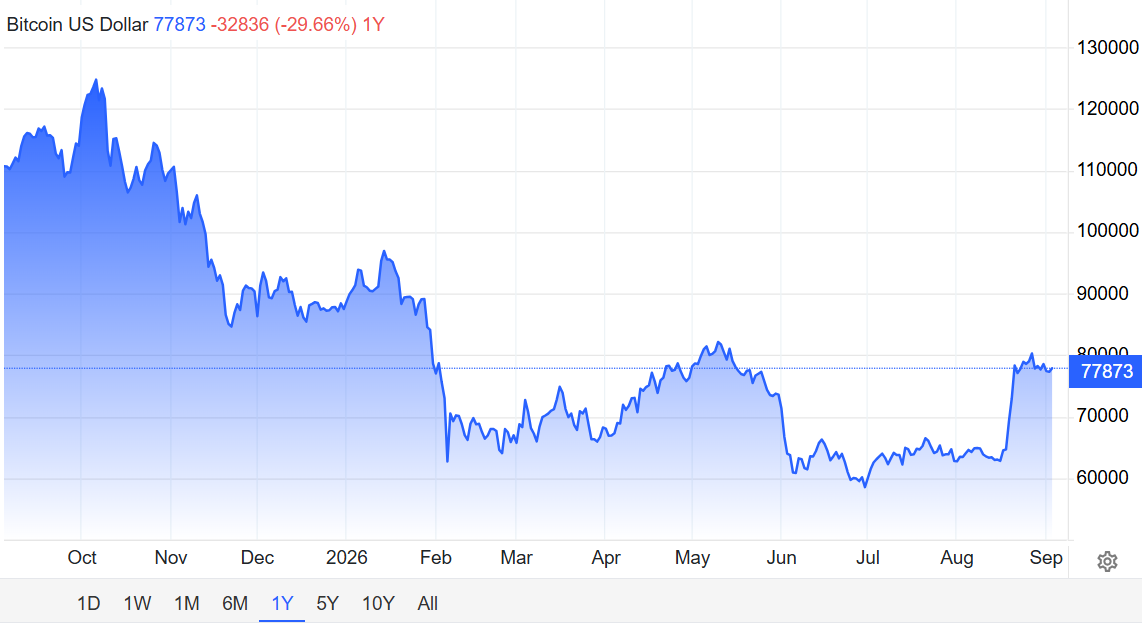
The Zhitong Finance App learned that after soaring about 25% in August, Bitcoin fell into a volatile situation in early September. Although the market once broke through the $80,000 psychological barrier, US investor demand continued to weaken, the probability of the Federal Reserve's interest rate hike soaring to 66% in September, and the supply “ceiling” for long-term holders of 1.05 million bitcoins in the range of $83,000 to $86,000 combined to form a triple resistance that made it difficult for Bitcoin to stand above $80,000. As of the September 3 press release, Bitcoin was reported at around $77,800, down about 2% over the past 7 days.
Multiple headwinds
August rebound: The market capitalization of 500 billion dollars returned, but US demand became the biggest “hidden lightning”
In August, Bitcoin rapidly climbed from around $63,500 to $80,000, increasing the total market capitalization of the cryptocurrency market by about $500 billion. The US spot Bitcoin ETF recorded a net inflow of about US$3.52 billion in the same month, a sharp increase from only US$172 million in July, making it the strongest monthly performance since October 2025.
However, there are obvious concerns about the inflow structure. Of the cumulative inflow of 3.05 billion US dollars from August 17 to 9, BlackRock IBIT alone contributed about 2.3 billion US dollars, accounting for 75.6%. Although a net inflow of about US$924.5 million was still recorded in the last week of August, single-day outflows have already begun to occur. Entering September, the sustainability of ETF capital inflows is being tested.
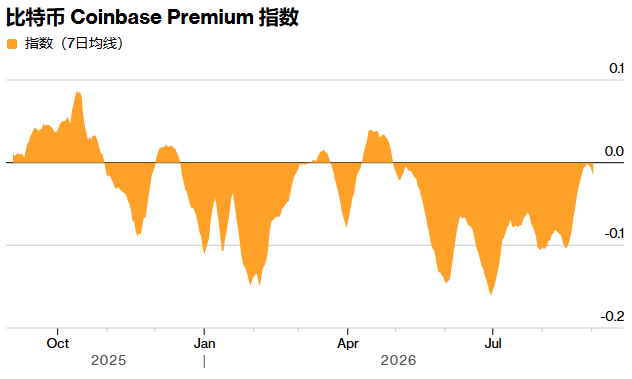
The Coinbase premium has been negative for more than four consecutive months, which is the most direct evidence of weak demand in the US. The indicator measures the price difference between international platforms such as Coinbase and Binance. Continued negative results mean that the buying intensity of US investors is significantly weaker than in other regions. Glassnode pointed out that the seven-day average daily gold intake of ETFs in this round of growth was US$290 million, but compared to the previous bull market, trading activity was low, and capital inflows driven by policy news “often coincide with local turning points.”
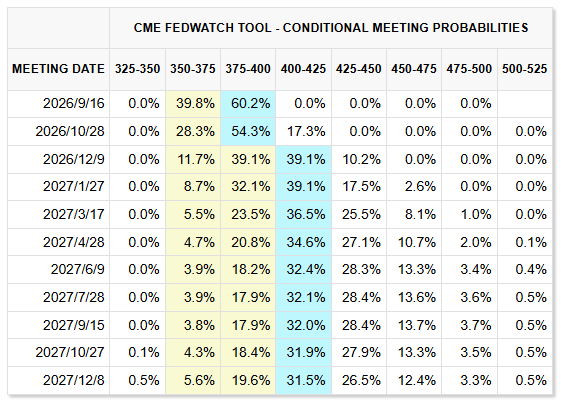
Macro headwinds: The probability of the Federal Reserve's interest rate hike soared to 60% in September, and Bitcoin took a sharp turn
Federal Reserve Chairman Kevin Walsh's hawkish speech at Jackson Hole became the core catalyst for the current round of Bitcoin's rise and fall. Walsh emphasized that current financial conditions are not tight, and that inflation must clearly move closer to the Federal Reserve's target. According to CME FedWatch data, the probability of a 25 basis point rate hike in September has soared from about 35% before the speech to 60%.
A sharp rise in interest rate hike expectations has directly weighed on risky assets. Bitcoin took a sharp turn from above $81,000 and at one point fell to around $76,000. Gate Research pointed out that the three major US stock indices have declined across the board in the past week, and Bitcoin fell about 2.14% to $77,336 during the same period. At the macro level, rising oil prices and rising US bond yields are continuing to disrupt risky assets.
On-chain resistance: “long-term holder ceiling” of 1.05 million BTC
Glassnode's on-chain data reveals structural resistance to Bitcoin's upside. The report shows that there is a supply of about 1.05 million bitcoins for long-term holders in the range of 83,000 to 86,000 US dollars. These chips have gone through a complete cycle of decline but have hardly been sold.
Glassnode describes this range as a “heavy structure,” composed almost entirely of supply from long-term holders (wallets that have not been sold for more than 6 months). Reaching $83,000 will test whether these holders will sell at breakeven. At the same time, there are also multiple liquidity structures between 81,000 and 86,000 US dollars, such as exchange sales orders.
This means that even if Bitcoin breaks through $80,000, the upper $83,000-$86,000 range will face a severe test of real demand.
Institutional opinions are divided: TD Cowen lowered year-end expectations, and bulls are still looking at $150,000
There is a clear differentiation in institutional behavior within the market. On the one hand, demand for US spot Bitcoin ETFs showed signs of cooling after experiencing strong summer inflows. On the other hand, since May 14, Strategy has insisted on continuing to buy above that price even when the market price is resistant around $80,000, becoming a key force against retail investors and short-term profit market selling pressure.
TD Cowen lowered Bitcoin's year-end forecast from about $140,000 to $97,500, based on the assumption that it is currently trading around $78,000 and that there is still room for about 25% increase by the end of the year.
The bulls are more optimistic. Fundstrat's Tom Lee predicts that Bitcoin will look at $150,000. The background is that Bitcoin is absorbing an increase of about 24% in August. Analyst Didier pointed out that Bitcoin's return to the 200-day EMA is the clearest technical indicator to bullish, marking the beginning of the bullish market.
CryptoQuant's bull market rating has been pushed to the most optimistic level since October 2025, with the model target price pointing to $81,319 on September 29. However, CryptoQuant also warned that Binance's Bitcoin reserves are rising while exchange stablecoin reserves are shrinking, which suggests that the market is in the distribution phase rather than accumulation.
The options market also reflects investors' conflicting mentality. Put options are mainly concentrated in the defensive range of $68,000 to $75,000, while the largest open call options are piled up at $80,000. The September 25 options expiration date, involving approximately $14 billion in open contracts, could become an important source of volatility and position pressure in the coming weeks.
IG Australia analyst Tony Sycamore pointed out that this wave of upward market growth was largely driven by bears' recovery rather than new positions opened by bulls. If the price falls back to the low of $70,000, buyers may provide support near the 200-day SMA ($69,507). Analysts Nansen warned that weak spot flows, divergent whale positions, and ETF capital outflows have yet to confirm a new round of bull market.
Technical side: The 200-day EMA fluctuates above the line, and the long and short game is heating up
Technically, the current trading price of Bitcoin is about $8,100 above the 200-day simple moving average and more than $9,400 above the 50-day SMA. The main moving averages are still on the upside, supporting the overall recovery structure.
However, the RSI has retreated from a high level to 66.7, and momentum has temporarily stagnated. The key support is near $69,600, which corresponds to the 50% Fibonacci retracement level, which closely matches the 200-day EMA of around $69,550. Sycamore indicated that if the price falls back to the mid-low of $70, buyers will provide strong support near the 200-day EMA ($69,507).