USDJPY Flashback Update: USDJPY Turns Lower Again as 160 Resistance Holds
We discussed USDJPY back on August 3, when the pair plunged sharply from the 164 area following BOJ intervention signals, suggesting that an important top could already be in place. Since then, the bearish scenario has continued to develop as anticipated. CHECK IT HERE
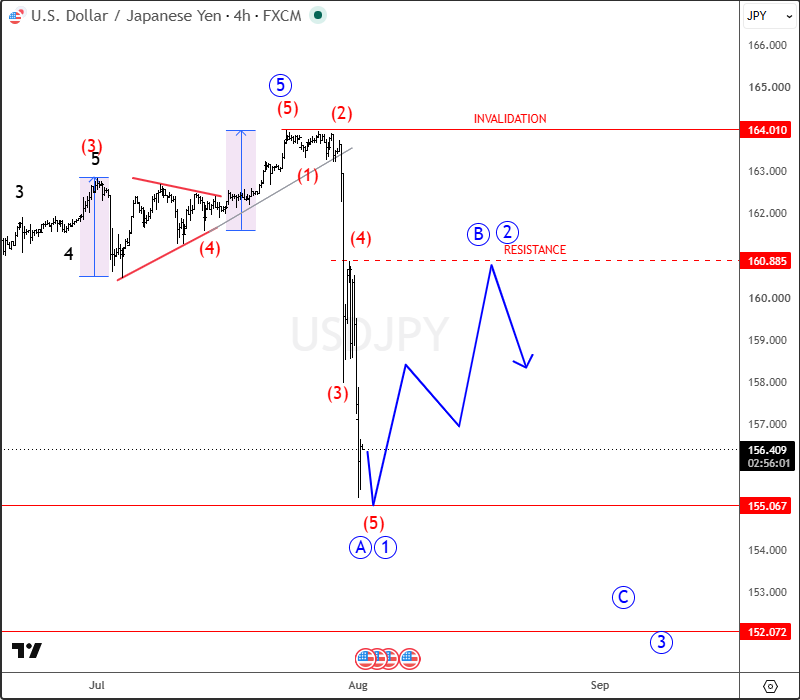
USDJPY has turned quite aggressively to the downside this summer on BoJ intervention signals, with a very sharp decline from 164. Given the strength and speed of the move as shown on the chart above, we assumed that an important top was already in place. That view was confirmed once price broke below the trendline support extending from the triangle in the previous bullish trend.
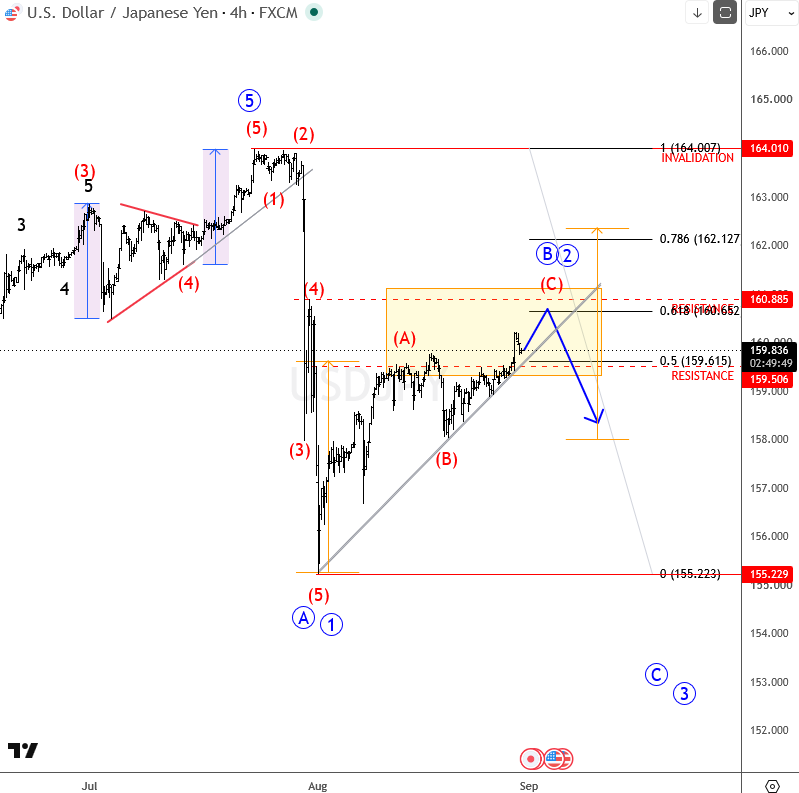
The market then stabilized and recovered from the 155 area, completing what can be viewed as a five-wave bearish decline into wave A/1. However, the subsequent recovery stalled near the 160 resistance area, creating what appears to be an ABC corrective recovery right in our yellow box that we highligted as an important resistance-reversal area.
Our Boxes
On our chart, this resistance zone was highlighted using our Trader Reversal Box — the yellow box shown
The purpose of this Box is simple:
It identifies areas where Elliott Wave projections, Fibonacci levels, and previous market structure align.
It marks zones where risk-to-reward conditions become attractive.
It helps traders prepare for potential reversals instead of reacting emotionally after the move has already started.
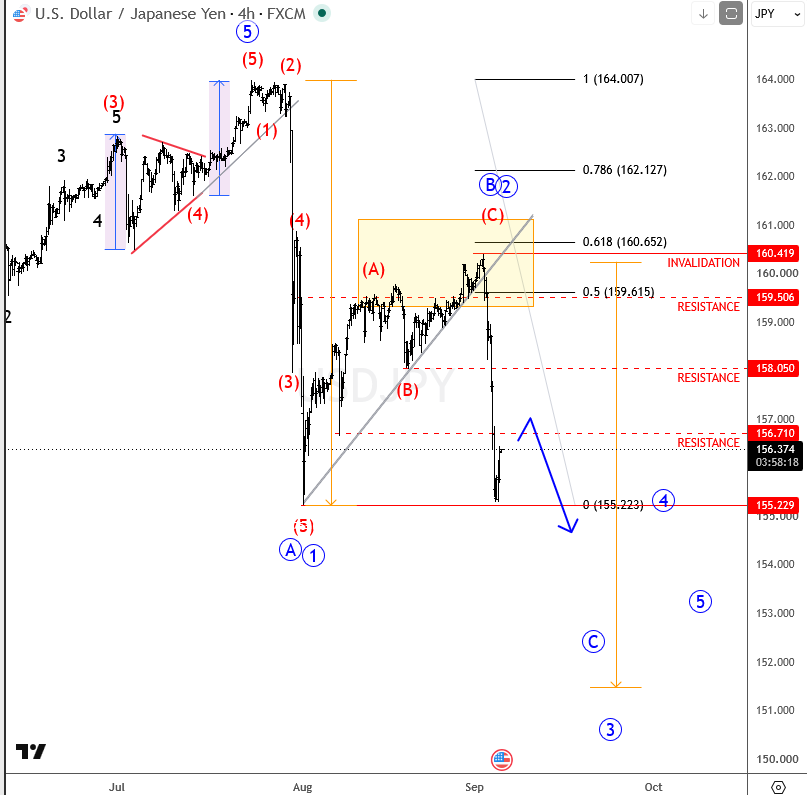
From there, USDJPY has seen fresh selling pressure, and a daily close back below the trendline further supports the bearish structure and suggests that the next leg lower could be underway.
The yen is also receiving fundamental support from increasingly hawkish expectations surrounding the Bank of Japan. Recent BOJ commentary has strengthened expectations for further rate hikes, while markets are pricing in a faster pace of monetary tightening. This is helping the JPY strengthen against the US dollar and adds further support to the bearish USDJPY outlook.
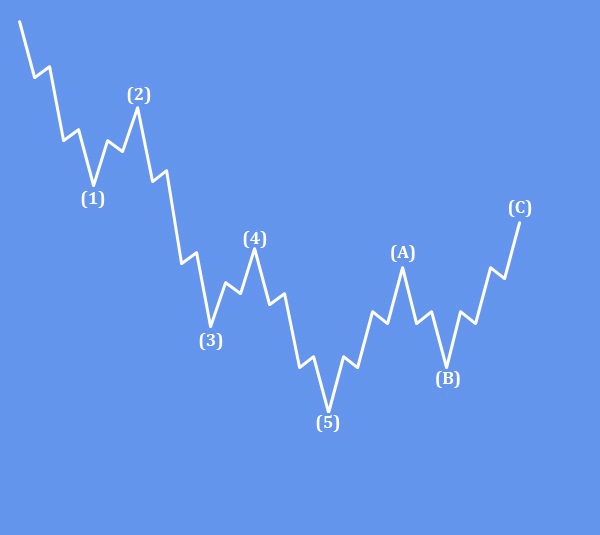
So what was the Elliott wave pattern, on that USDJPY example?
Well, from an Elliott Wave perspective, the current structure was clear; particularly interesting: a five-wave decline from the 164 area , followed by an ABC corrective recovery toward 160. Thats strong bearish development pattern, and reason why we views pair bearish.