
European Dividend Stocks To Enhance Your Portfolio
As European markets navigate mixed economic signals and geopolitical developments, the pan-European STOXX Europe 600 Index has shown resilience, ending the week with a slight gain. In this context, dividend stocks can offer stability and income potential to investors seeking to enhance their portfolios amidst fluctuating market conditions.
Top 10 Dividend Stocks In Europe
| Name | Dividend Yield | Dividend Rating |
| Telekom Austria (WBAG:TKA) | 4.13% | ★★★★★★ |
| Swiss Re (SWX:SREN) | 4.50% | ★★★★★☆ |
| Rubis (ENXTPA:RUI) | 6.06% | ★★★★★★ |
| Maire (BIT:MAIRE) | 4.80% | ★★★★★☆ |
| Hannover Rück (XTRA:HNR1) | 4.75% | ★★★★★★ |
| Etex (ENXTBR:094124453) | 7.69% | ★★★★★★ |
| EFG International (SWX:EFGN) | 4.16% | ★★★★★☆ |
| Edel SE KGaA (XTRA:EDL) | 6.64% | ★★★★★★ |
| Cembra Money Bank (SWX:CMBN) | 5.08% | ★★★★★★ |
| Banque Cantonale Vaudoise (SWX:BCVN) | 3.30% | ★★★★★☆ |
Click here to see the full list of 196 stocks from our Top European Dividend Stocks screener.
Let's take a closer look at a couple of our picks from the screened companies.
BPER Banca (BIT:BPE)
Simply Wall St Dividend Rating: ★★★★☆☆
Overview: BPER Banca SpA provides a range of banking products and services for individuals, businesses, and professionals in Italy and internationally, with a market cap of €29.82 billion.
Operations: BPER Banca's revenue is primarily derived from its Core Business segments, with Retail generating €3.27 billion, Corporate contributing €1.16 billion, and Private & Wealth Management adding €544.71 million, alongside Non-core activities which account for €1.41 billion.
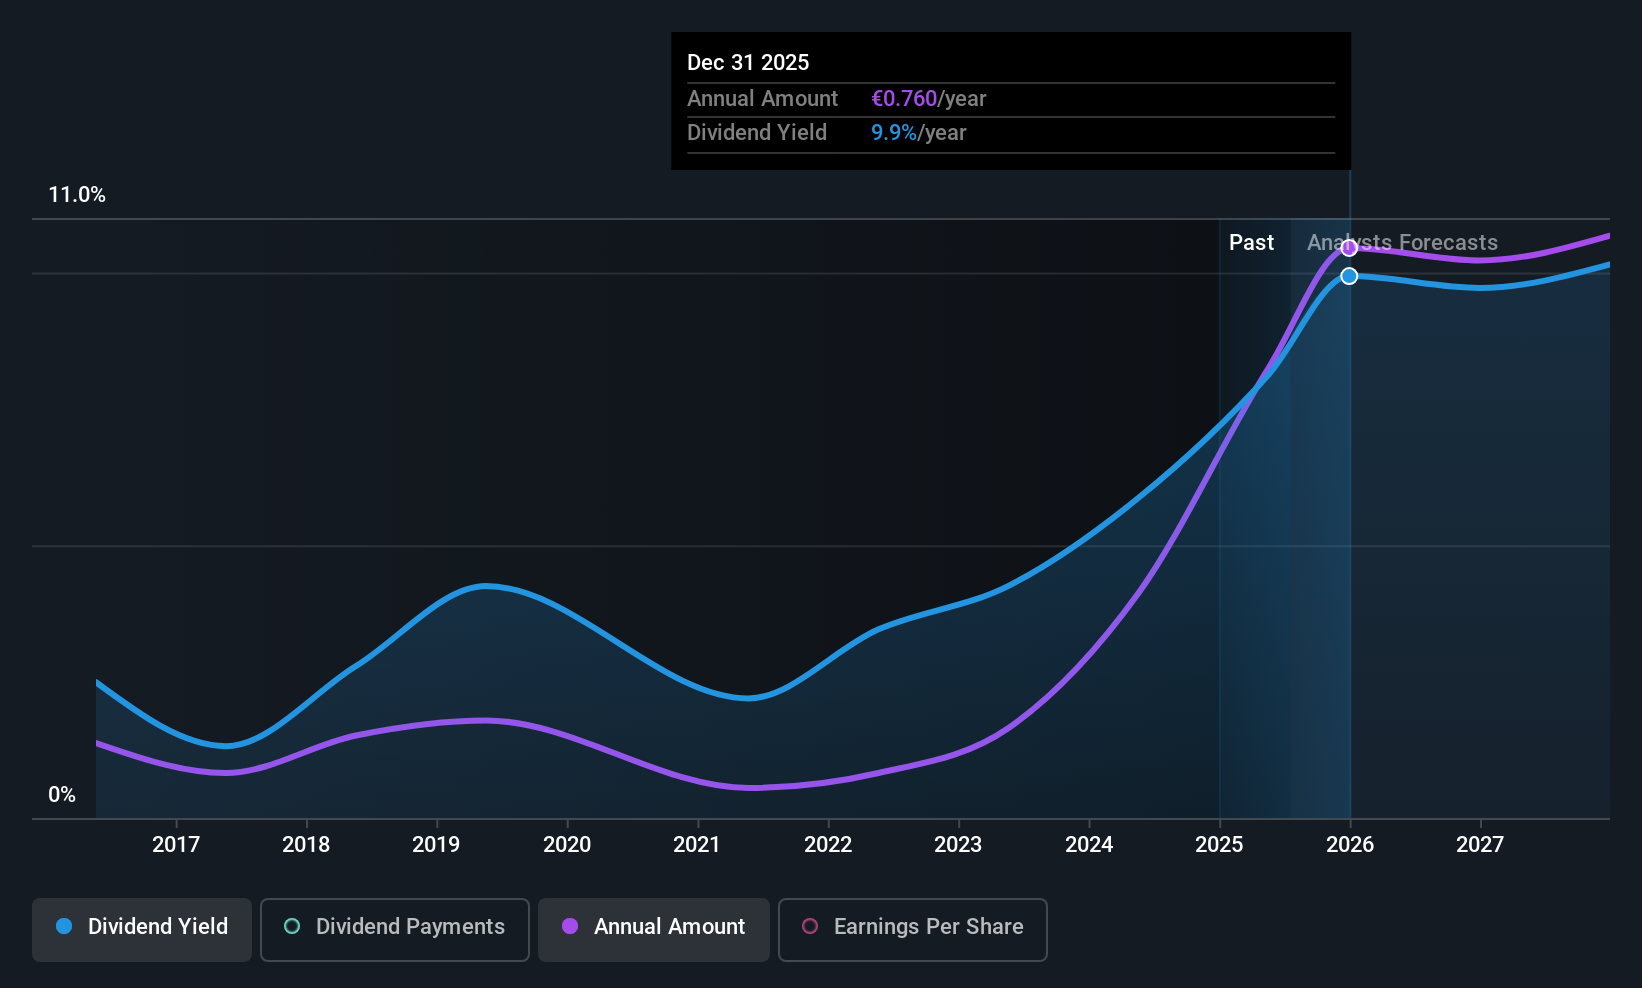
Dividend Yield: 4.5%
BPER Banca's recent earnings report shows strong net income growth, with a 38.5% increase over the past year, indicating robust profitability that supports its dividend payments. Despite a volatile dividend history in the past decade, dividends have grown and are currently well-covered by earnings with a 48.8% payout ratio. However, its current yield of 4.55% is slightly below Italy's top-tier dividend payers. The bank's strategic debt management further enhances financial stability.
- Navigate through the intricacies of BPER Banca with our comprehensive dividend report here.
- Insights from our recent valuation report point to the potential undervaluation of BPER Banca shares in the market.
Banco Bilbao Vizcaya Argentaria (BME:BBVA)
Simply Wall St Dividend Rating: ★★★★☆☆
Overview: Banco Bilbao Vizcaya Argentaria, S.A., along with its subsidiaries, offers a range of financial services across Spain, Mexico, Turkey, South America, Europe, the United States, and Asia with a market cap of €140.07 billion.
Operations: Banco Bilbao Vizcaya Argentaria's revenue segments include €12.43 billion from Mexico, €5.28 billion from Turkey, €5.46 billion from South America, and €9.18 billion from Spain (including Non-Core Real Estate).
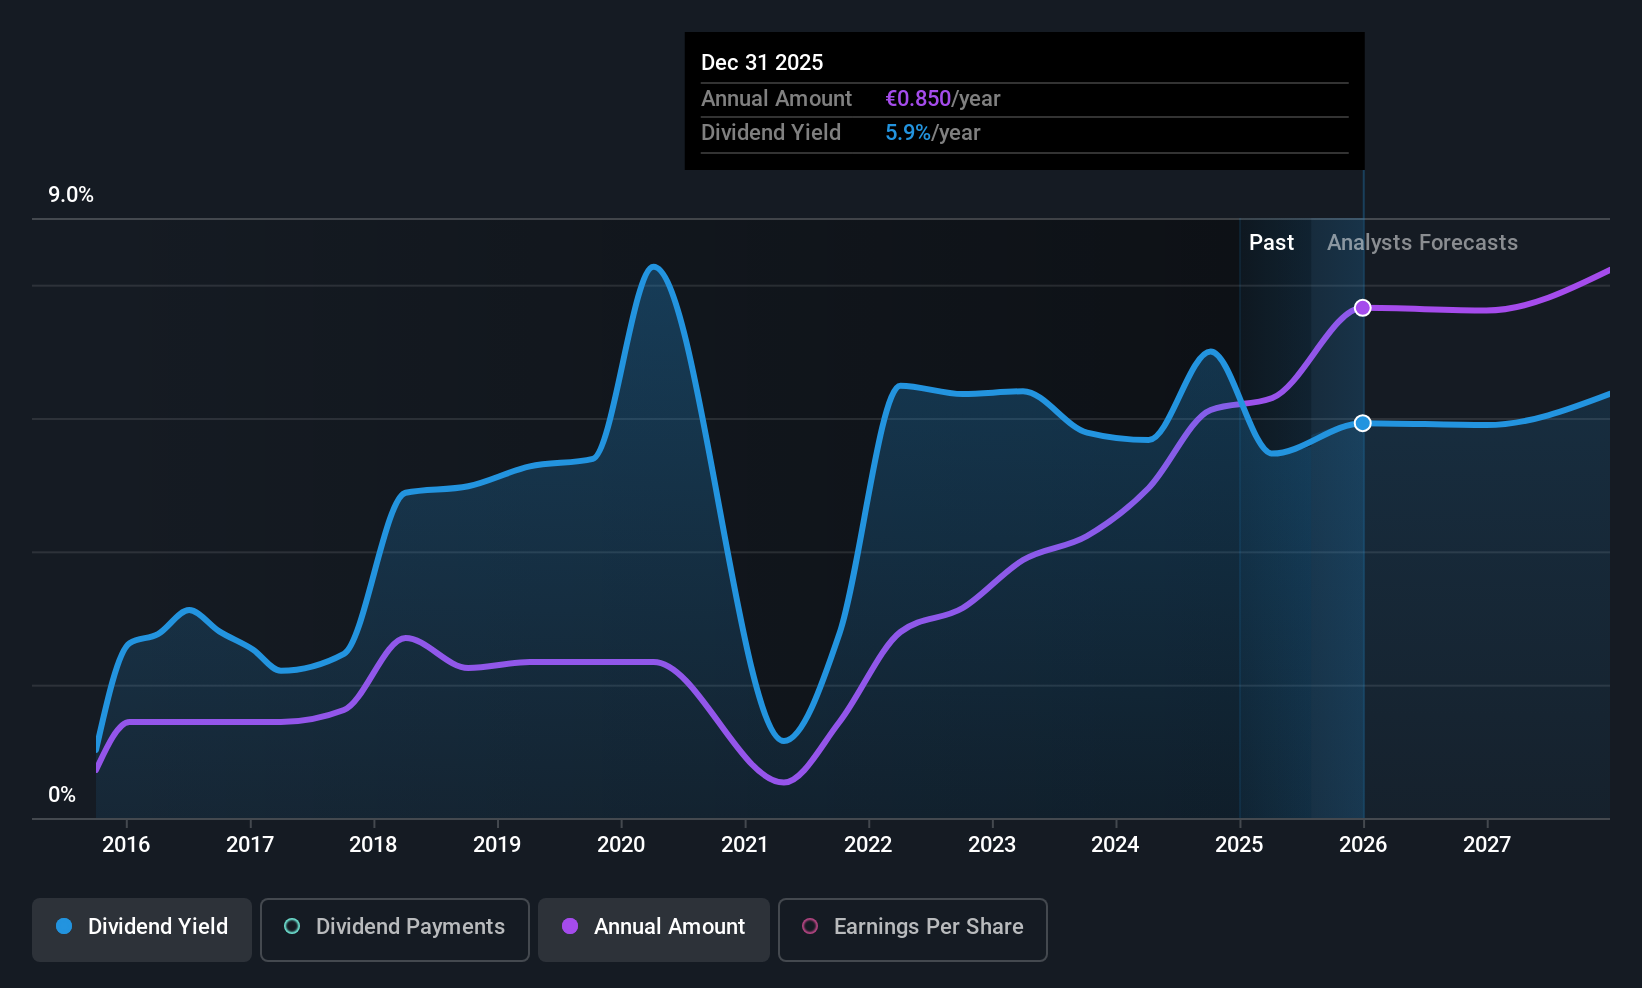
Dividend Yield: 3.6%
Banco Bilbao Vizcaya Argentaria's dividend payments have been volatile over the past decade, yet they remain well-covered by earnings with a current payout ratio of 31.7%, forecasted to rise to 49.9% in three years. Trading at a discount compared to its estimated fair value, BBVA's dividend yield of 3.62% lags behind Spain's top-tier payers. Recent fixed-income offerings totaling $2.3 billion indicate strategic financial maneuvers aimed at bolstering capital reserves and managing debt efficiently.
- Get an in-depth perspective on Banco Bilbao Vizcaya Argentaria's performance by reading our dividend report here.
- Our comprehensive valuation report raises the possibility that Banco Bilbao Vizcaya Argentaria is priced lower than what may be justified by its financials.
AXA (ENXTPA:CS)
Simply Wall St Dividend Rating: ★★★★☆☆
Overview: AXA SA, with a market cap of €89.44 billion, operates globally through its subsidiaries offering insurance, asset management, and banking services.
Operations: AXA SA generates revenue from several segments: AXA XL (€19.35 billion), Europe (€37.30 billion), France (€25.09 billion), and Asia, Africa & EME-LATAM (€14.01 billion).
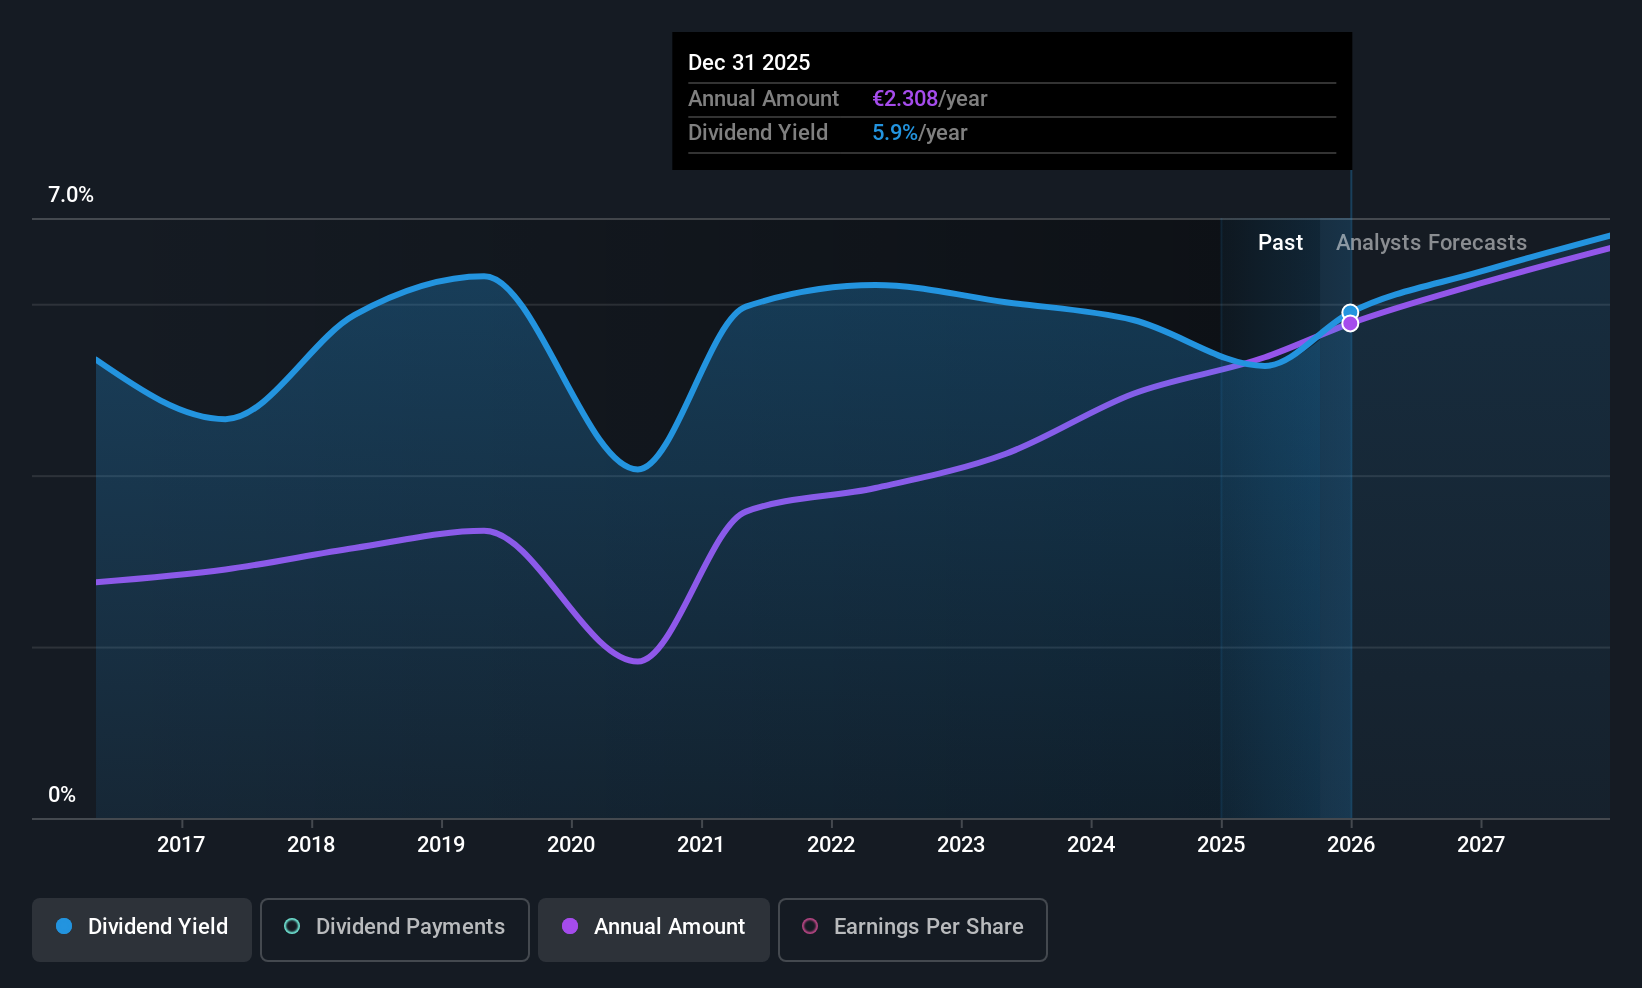
Dividend Yield: 5.2%
AXA's dividend payments have been volatile over the past decade, but they are well-covered by earnings and cash flows, with payout ratios of 62.3% and 32.4%, respectively. Trading significantly below its estimated fair value, AXA offers a dividend yield that is slightly lower than France's top-tier payers. Recent earnings showed improvement, with net income rising to €4.17 billion for H1 2026 from €3.92 billion a year ago, suggesting robust financial health amidst leadership changes.
- Take a closer look at AXA's potential here in our dividend report.
- In light of our recent valuation report, it seems possible that AXA is trading behind its estimated value.
Seize The Opportunity
- Discover the full array of 196 Top European Dividend Stocks right here.
- Have you diversified into these companies? Leverage the power of Simply Wall St's portfolio to keep a close eye on market movements affecting your investments.
- Simply Wall St is a revolutionary app designed for long-term stock investors, it's free and covers every market in the world.
Looking For Alternative Opportunities?
- Explore high-performing small cap companies that haven't yet garnered significant analyst attention.
- Fuel your portfolio with companies showing strong growth potential, backed by optimistic outlooks both from analysts and management.
- Find companies with promising cash flow potential yet trading below their fair value.
This article by Simply Wall St is general in nature. We provide commentary based on historical data and analyst forecasts only using an unbiased methodology and our articles are not intended to be financial advice. It does not constitute a recommendation to buy or sell any stock, and does not take account of your objectives, or your financial situation. We aim to bring you long-term focused analysis driven by fundamental data. Note that our analysis may not factor in the latest price-sensitive company announcements or qualitative material. Simply Wall St has no position in any stocks mentioned.
Have feedback on this article? Concerned about the content? Get in touch with us directly. Alternatively, email editorial-team@simplywallst.com