
This Indicator Could Be the S&P 500’s Canary in a Coal Mine
I spend a lot of time analyzing exchange-traded funds (ETFs) here. And while you might think that’s because I’ve analyzed those securities individually for a long time (I have), the thing about ETF analysis is this: if you do enough of it, for enough years, you start to see patterns of behavior. And while they don’t always immediately say “buy this” or “sell this,” they do something I think is at least as important to traders and investors.
ETFs can help us figure out when early risk has a shot of becoming big risk. Which often leads to big losses. And I’m all about minimizing that.
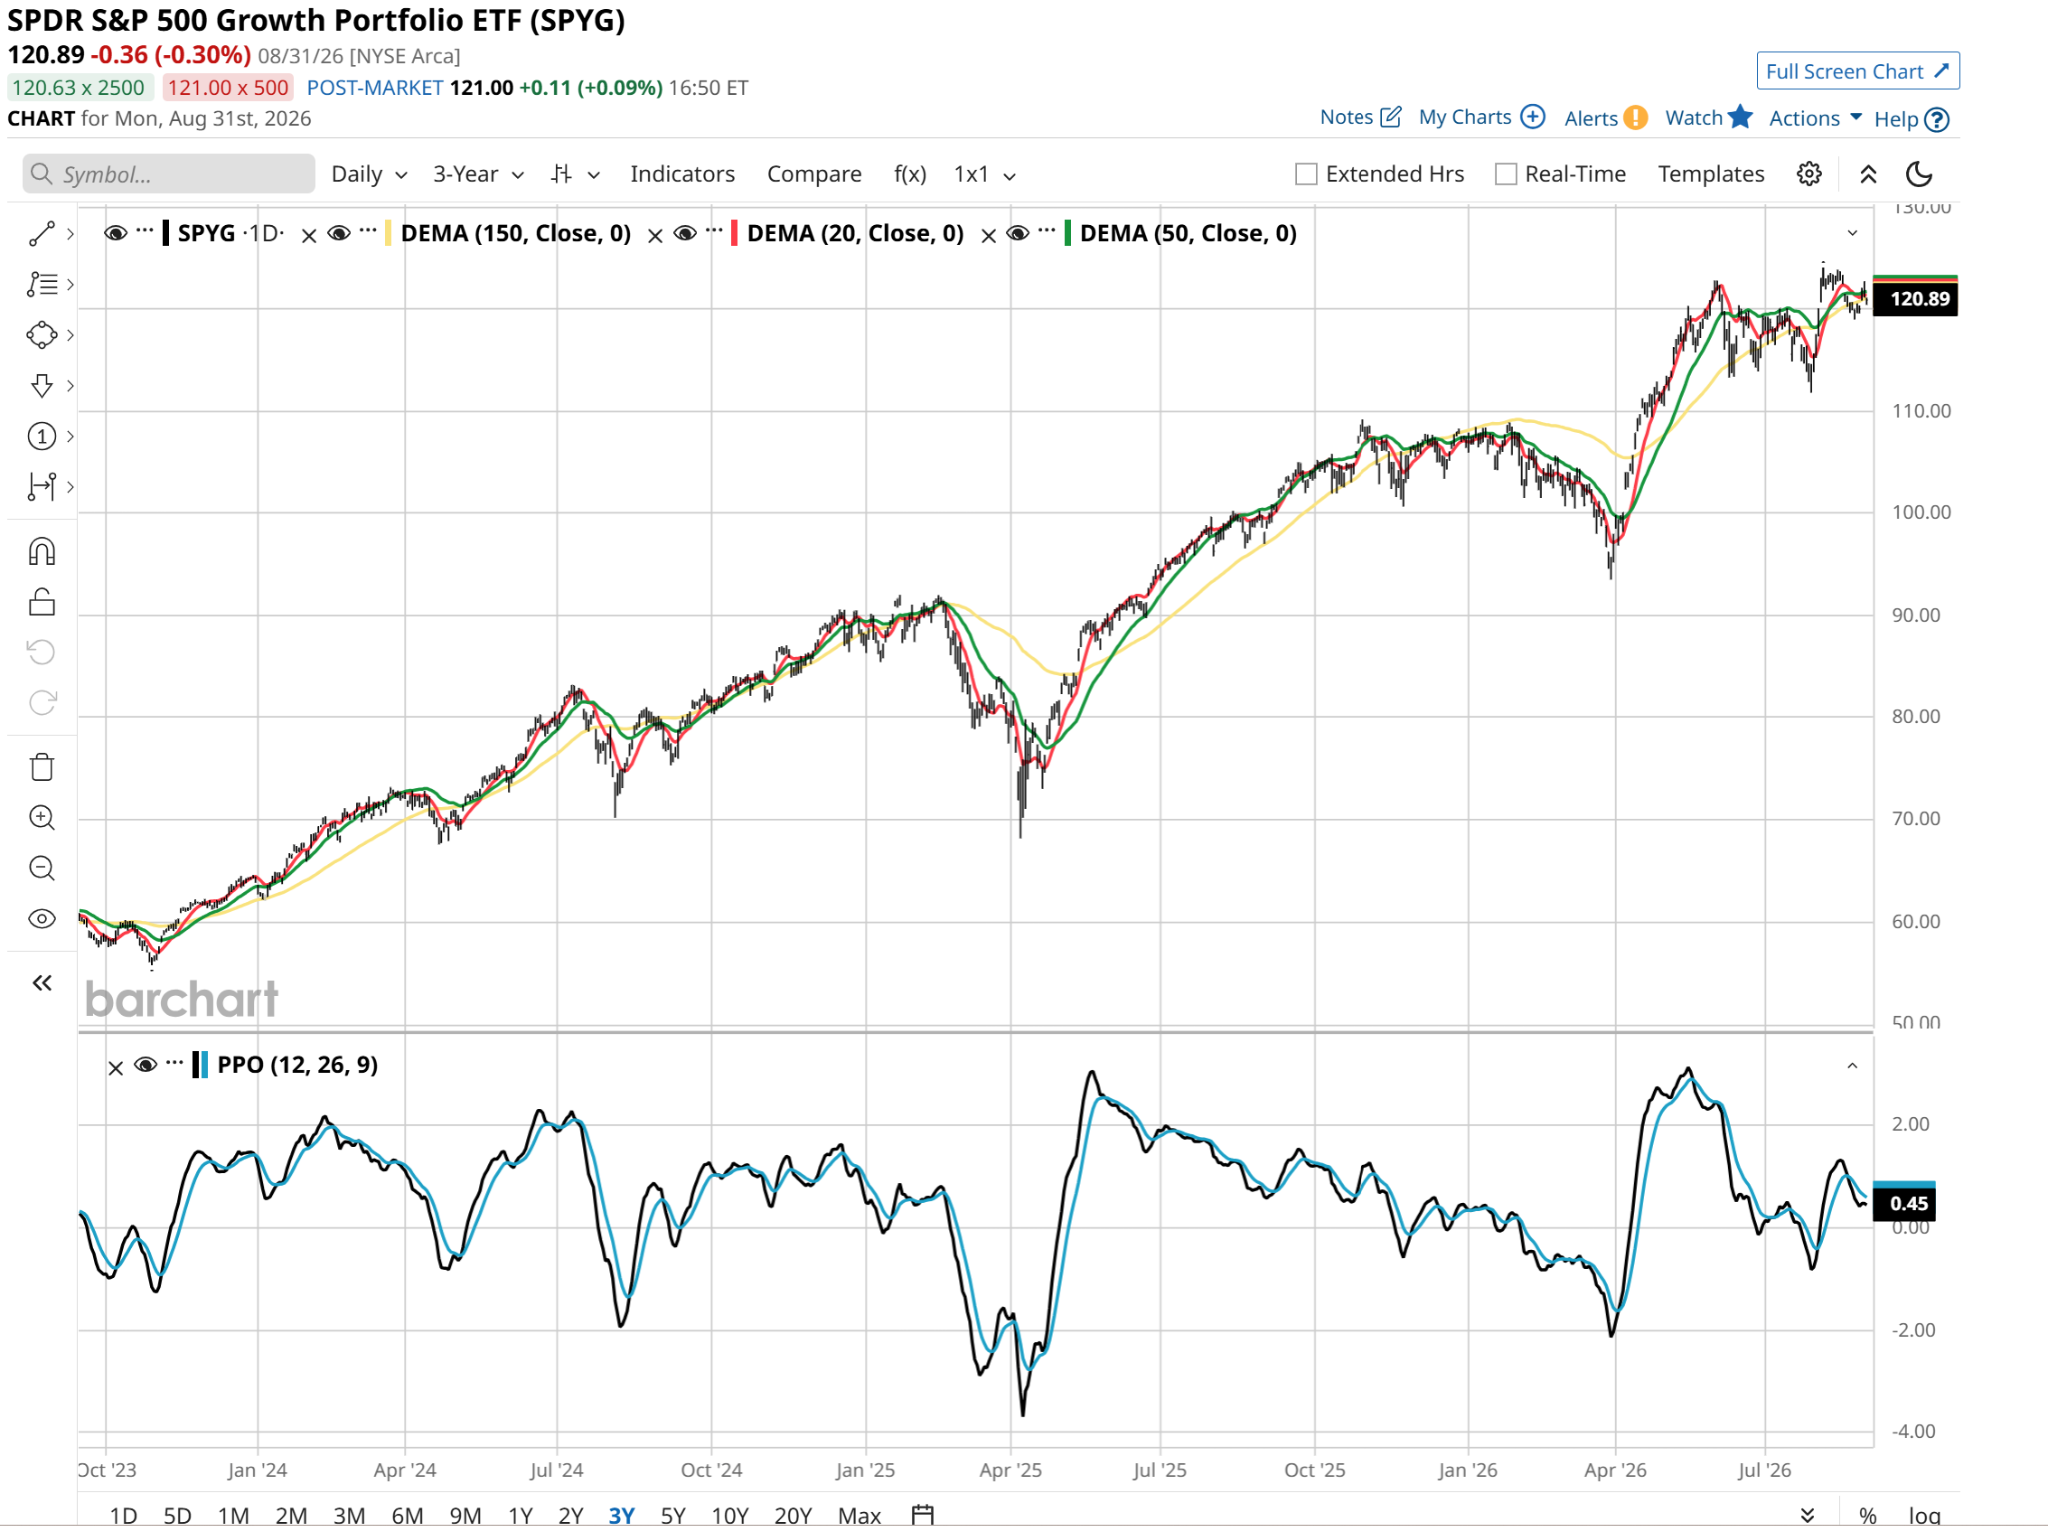
So when I do my routine ETF chart perusing, going through hundreds here each week, this one does not stand out on its own. It is the SPDR S&P 500 Growth Portfolio ETF (SPYG), and it owns 150 of the stocks of the S&P 500 Index ($SPX) — the ones that are judged to have growth characteristics. Collectively, they sell for a hefty 26x trailing 12-month earnings.
I’ll also note that SPDR S&P 500 Value Portfolio ETF (SPYV), the alter ego of SPYG, covers S&P 500 value stocks and includes more than 400 stocks. Some names cross over to both camps, growth and value. But the fact that there are nearly three times as many value stocks as growth stocks, and growth has led this market higher for years, makes SPYG a real benchmark to watch.
And while I watch it in this form — daily prices — I see nothing special. Not bullish, not especially bearish. But wait, there’s more.
This chart below shows a trend brewing. It says that the growth segment of the S&P 500 is starting to lose steam. Not long ago, 70% of stocks in this index were above their 50-day averages. Now, that figure is under 45%.
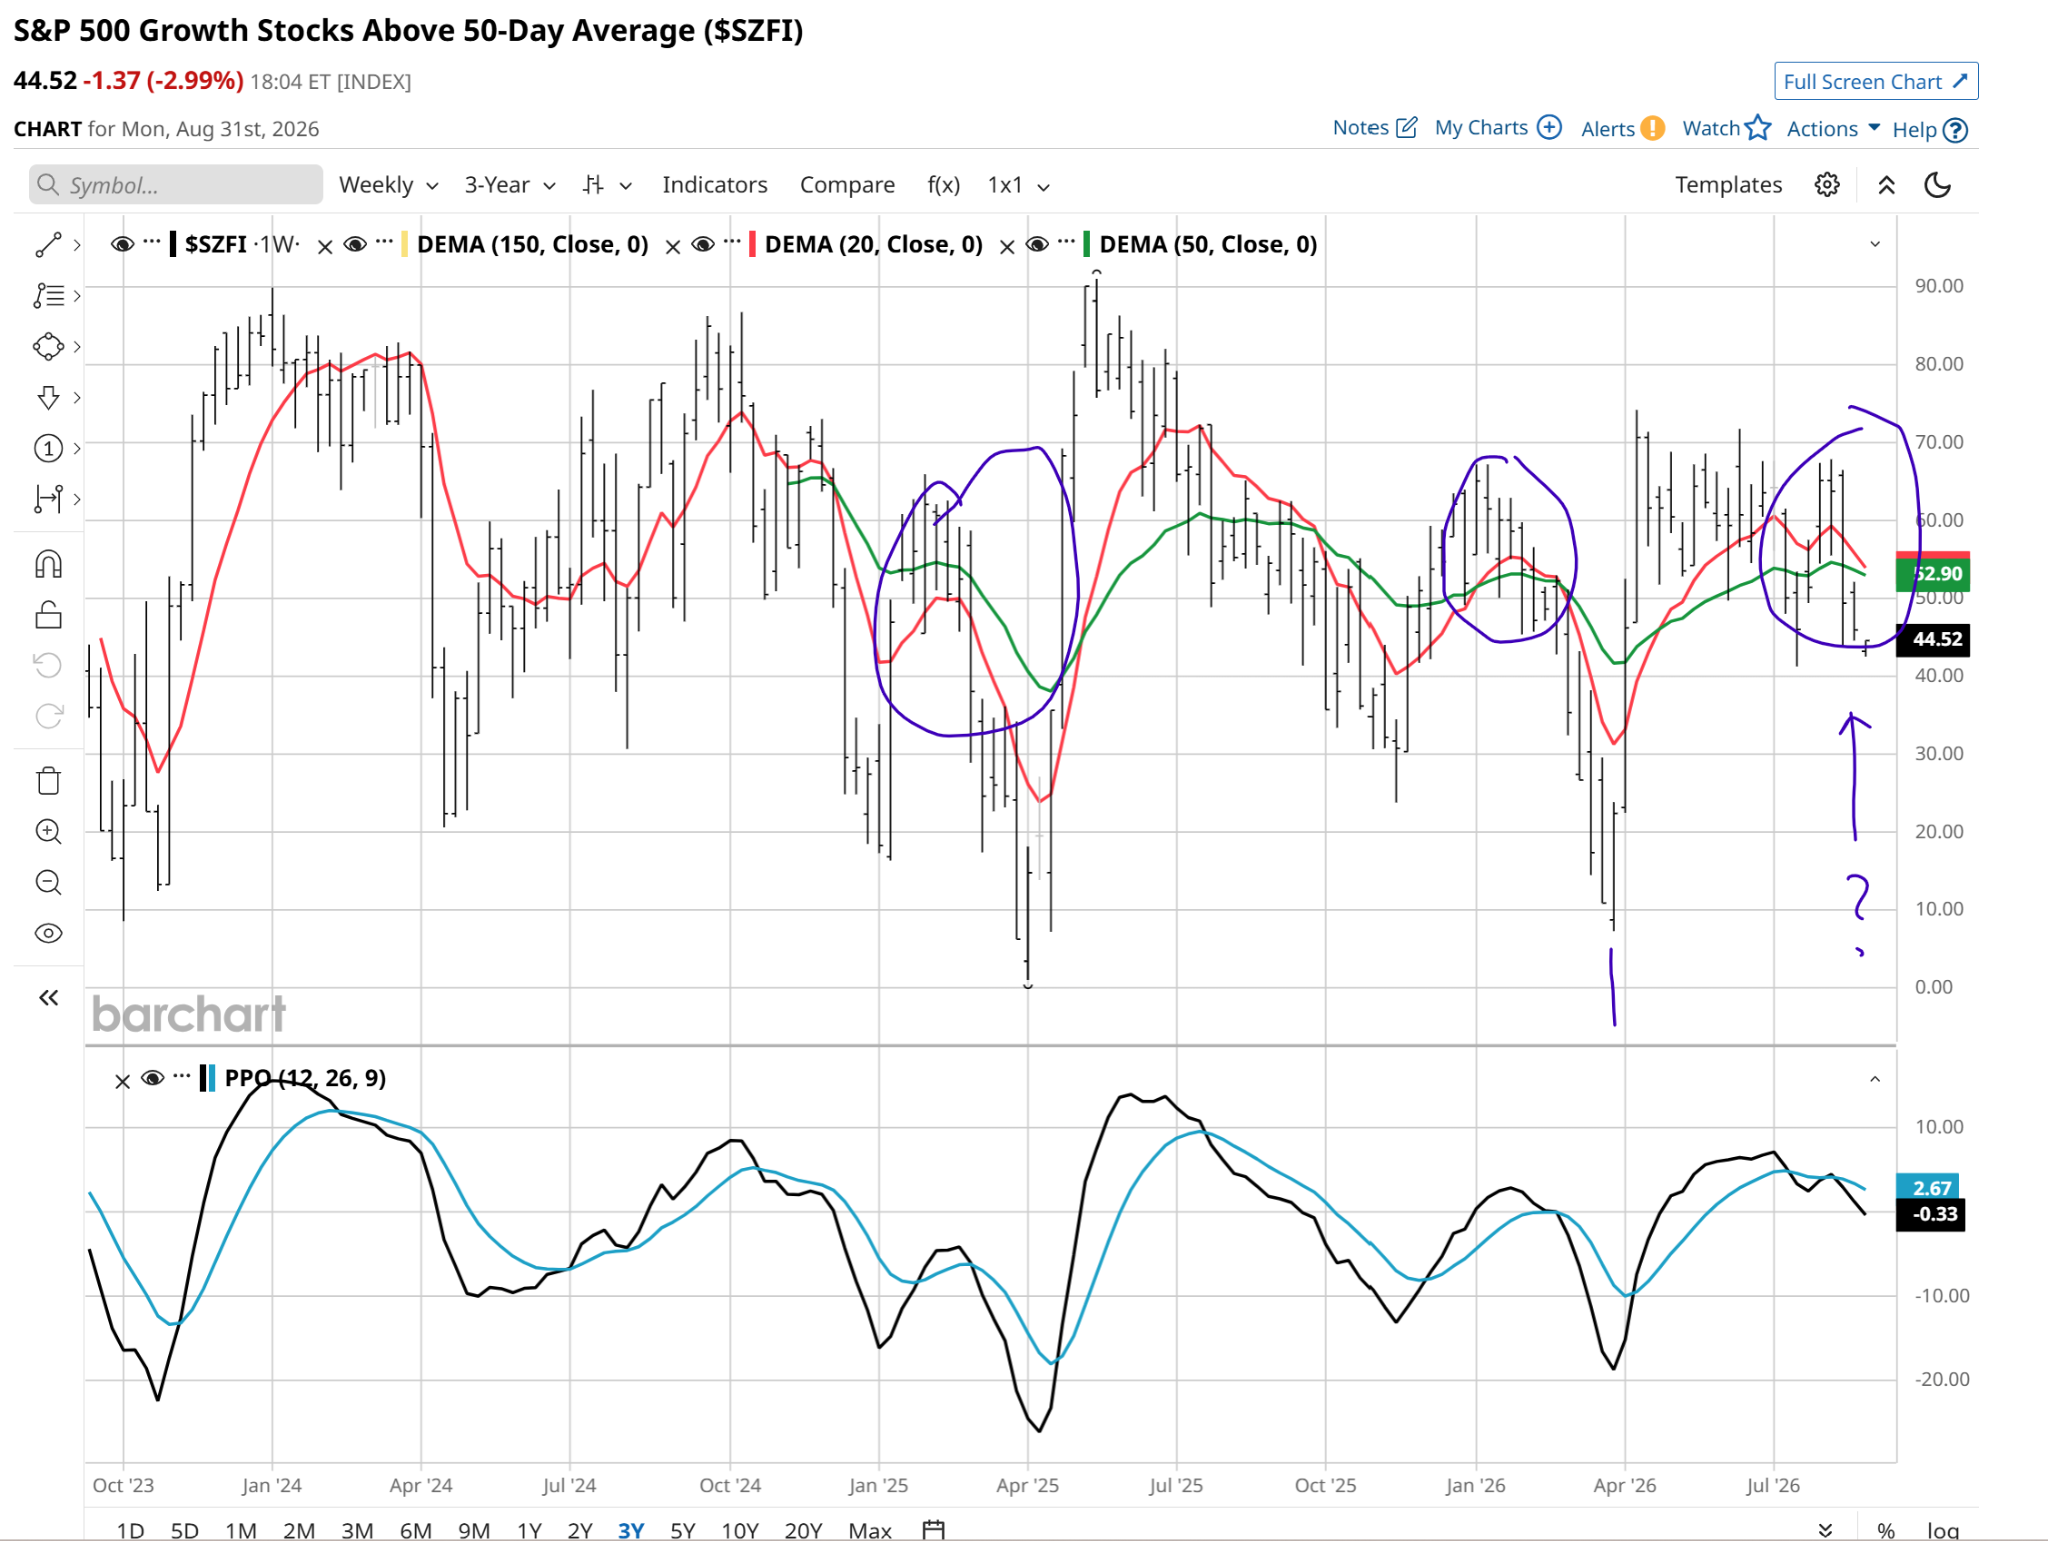
Again, this is an early indicator. But it is the same one that fired in early 2025 and early 2026, before we saw declines in the broader S&P 500 of 20% and nearly 10%, respectively.
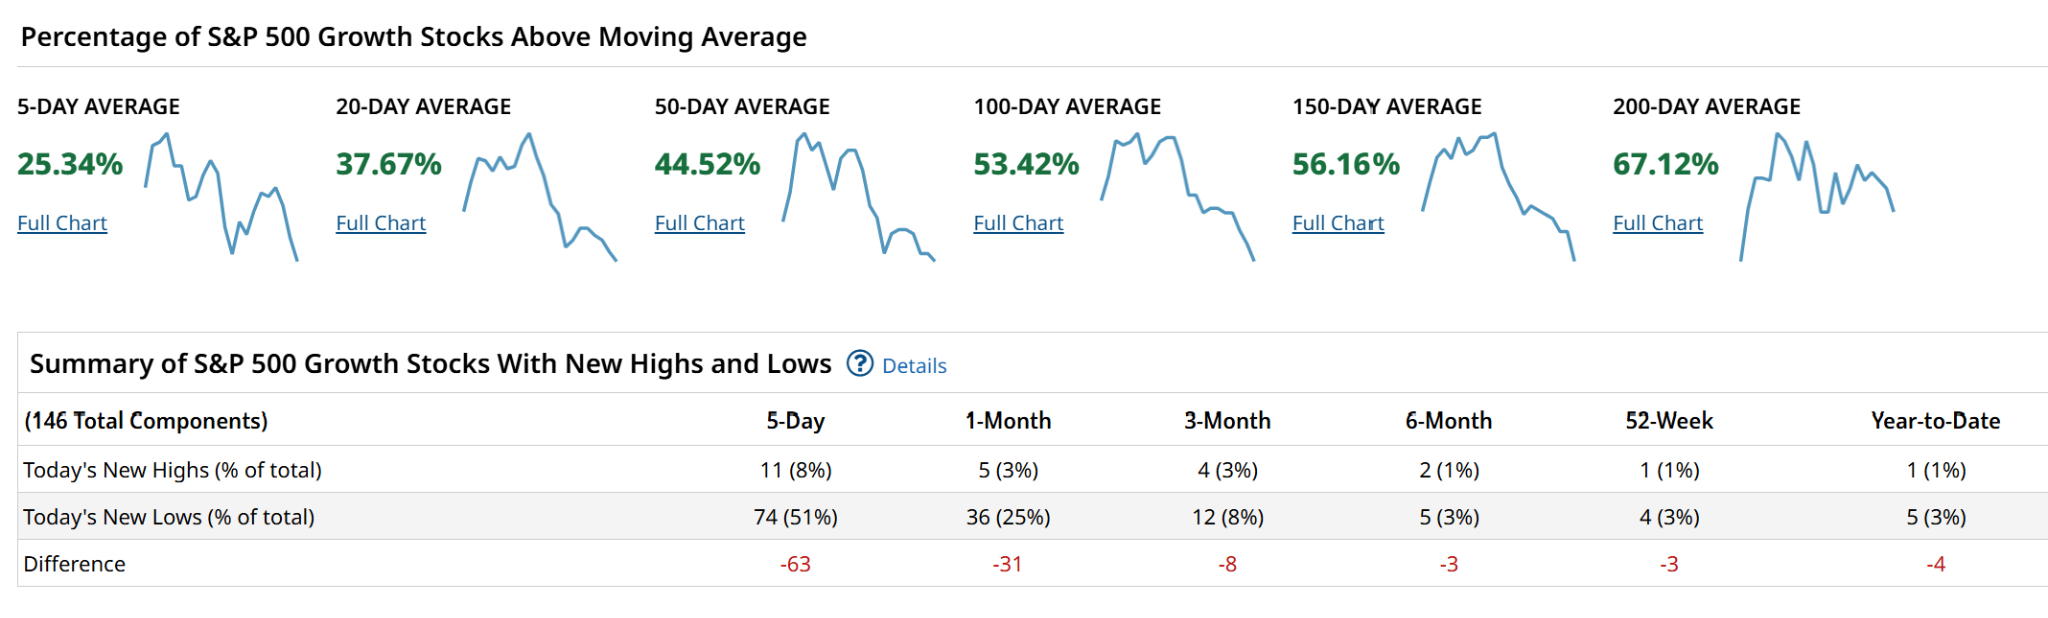
There’s a treasure trove of information on Barchart that goes much deeper on this issue. Here, we see that even fewer stocks are above their 20-day and five-day averages. See how the figures from left to right are rising. That’s an early sign that momentum is fading. Just as the summer slumber is ending for traders and investors.
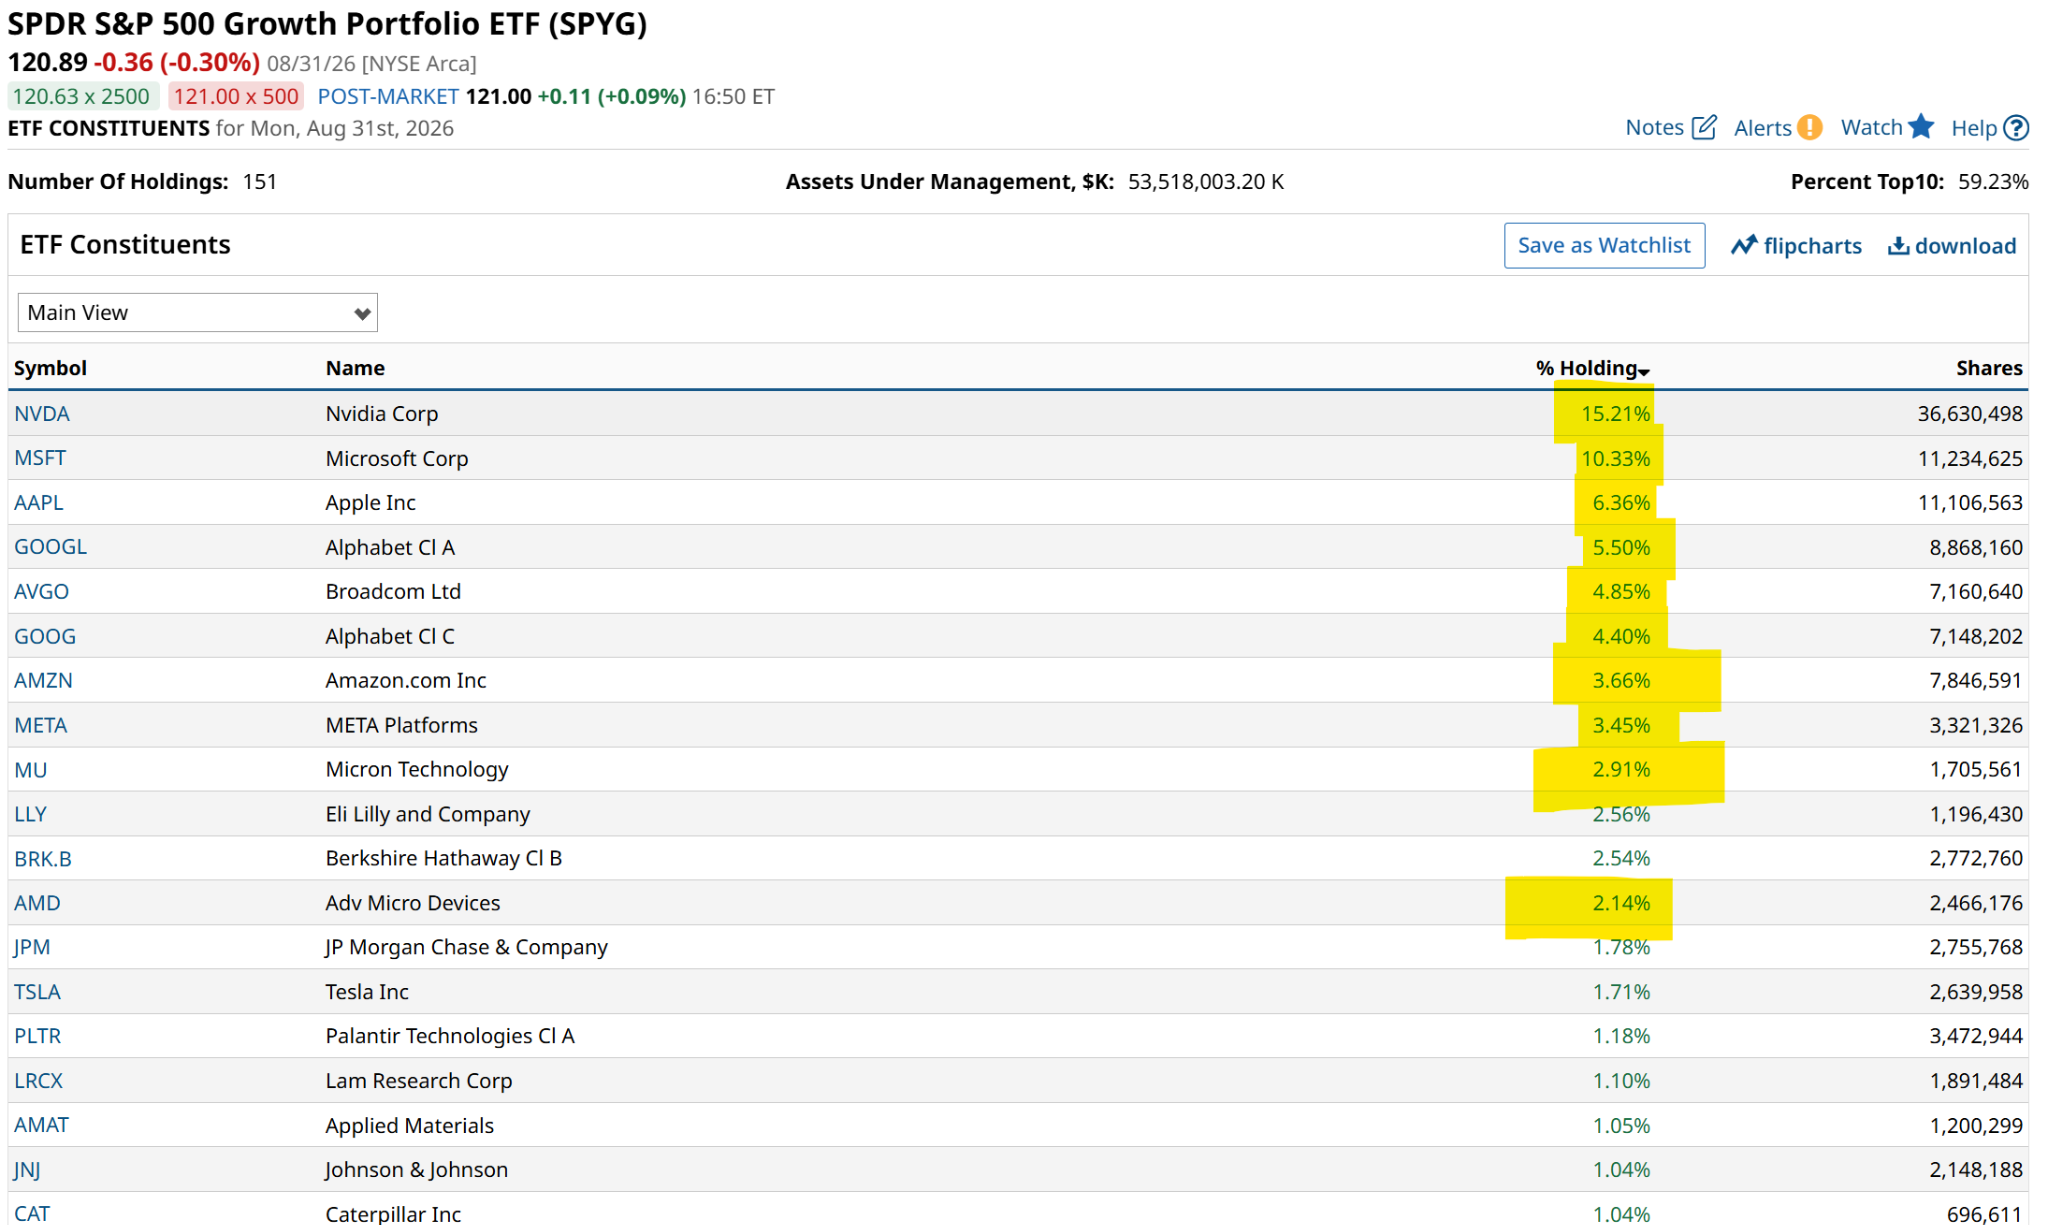
But there’s a more concerning aspect of this emerging trend. Below, I’ve highlighted in yellow the nine stocks that make up nearly 60% of SPYG. The other 140 stocks only comprise 40% of the ETF’s asset base. Another in a long line of evidence. Not that the market is about to fall, but that it is hanging on the fortunes of a very small segment of its overall population.
And while there have been many times when I would be confident that value stocks will bail out growth stocks, this is not one of those times. I see little in the way of backup support in this market.
You see, on the surface, the S&P 500 often presents an illusion of serene stability, characterized by modest index-level drawdowns and steady multi-year trends. But beneath that calm exterior lies an extraordinary level of single-stock dispersion and churn.
The (Earnings) Beat Goes On, But the Stock’s Rise Doesn’t
It has become a common scenario, a wash-rinse-repeat sort of thing. A company reports a temporary earnings beat, announces some artificial intelligence (AI) initiative, or gets swept up in a brief sector rotation, causing its share price to sprint 40% to 80% higher in a matter of weeks. However, because so much of that momentum is driven by systematic trend-following algorithms, short-dated option gamma squeezes, and retail enthusiasm rather than durable institutional buying, the gains prove paper-thin.
Once buying volume slows, the stock begins a steep descent, surrendering all of its gains and returning right back to where it started. Or even breaking down to new lows. Investors who bought the breakout end up trapped, while those who held through the peak watch substantial paper gains vanish into thin air.
Modern markets are such that this type of situation is even more fragile. Systematic commodity trading advisors (CTAs), quantitative momentum strategies, and high-frequency options flows dominate daily volume. I see it in my own trading, constantly, and at many different parts of the day.
When an S&P 500 constituent delivers flawless execution, these automated engines fuel explosive upside runs. But when a company slips, the market’s repricing of its stock is not as orderly as it used to be.
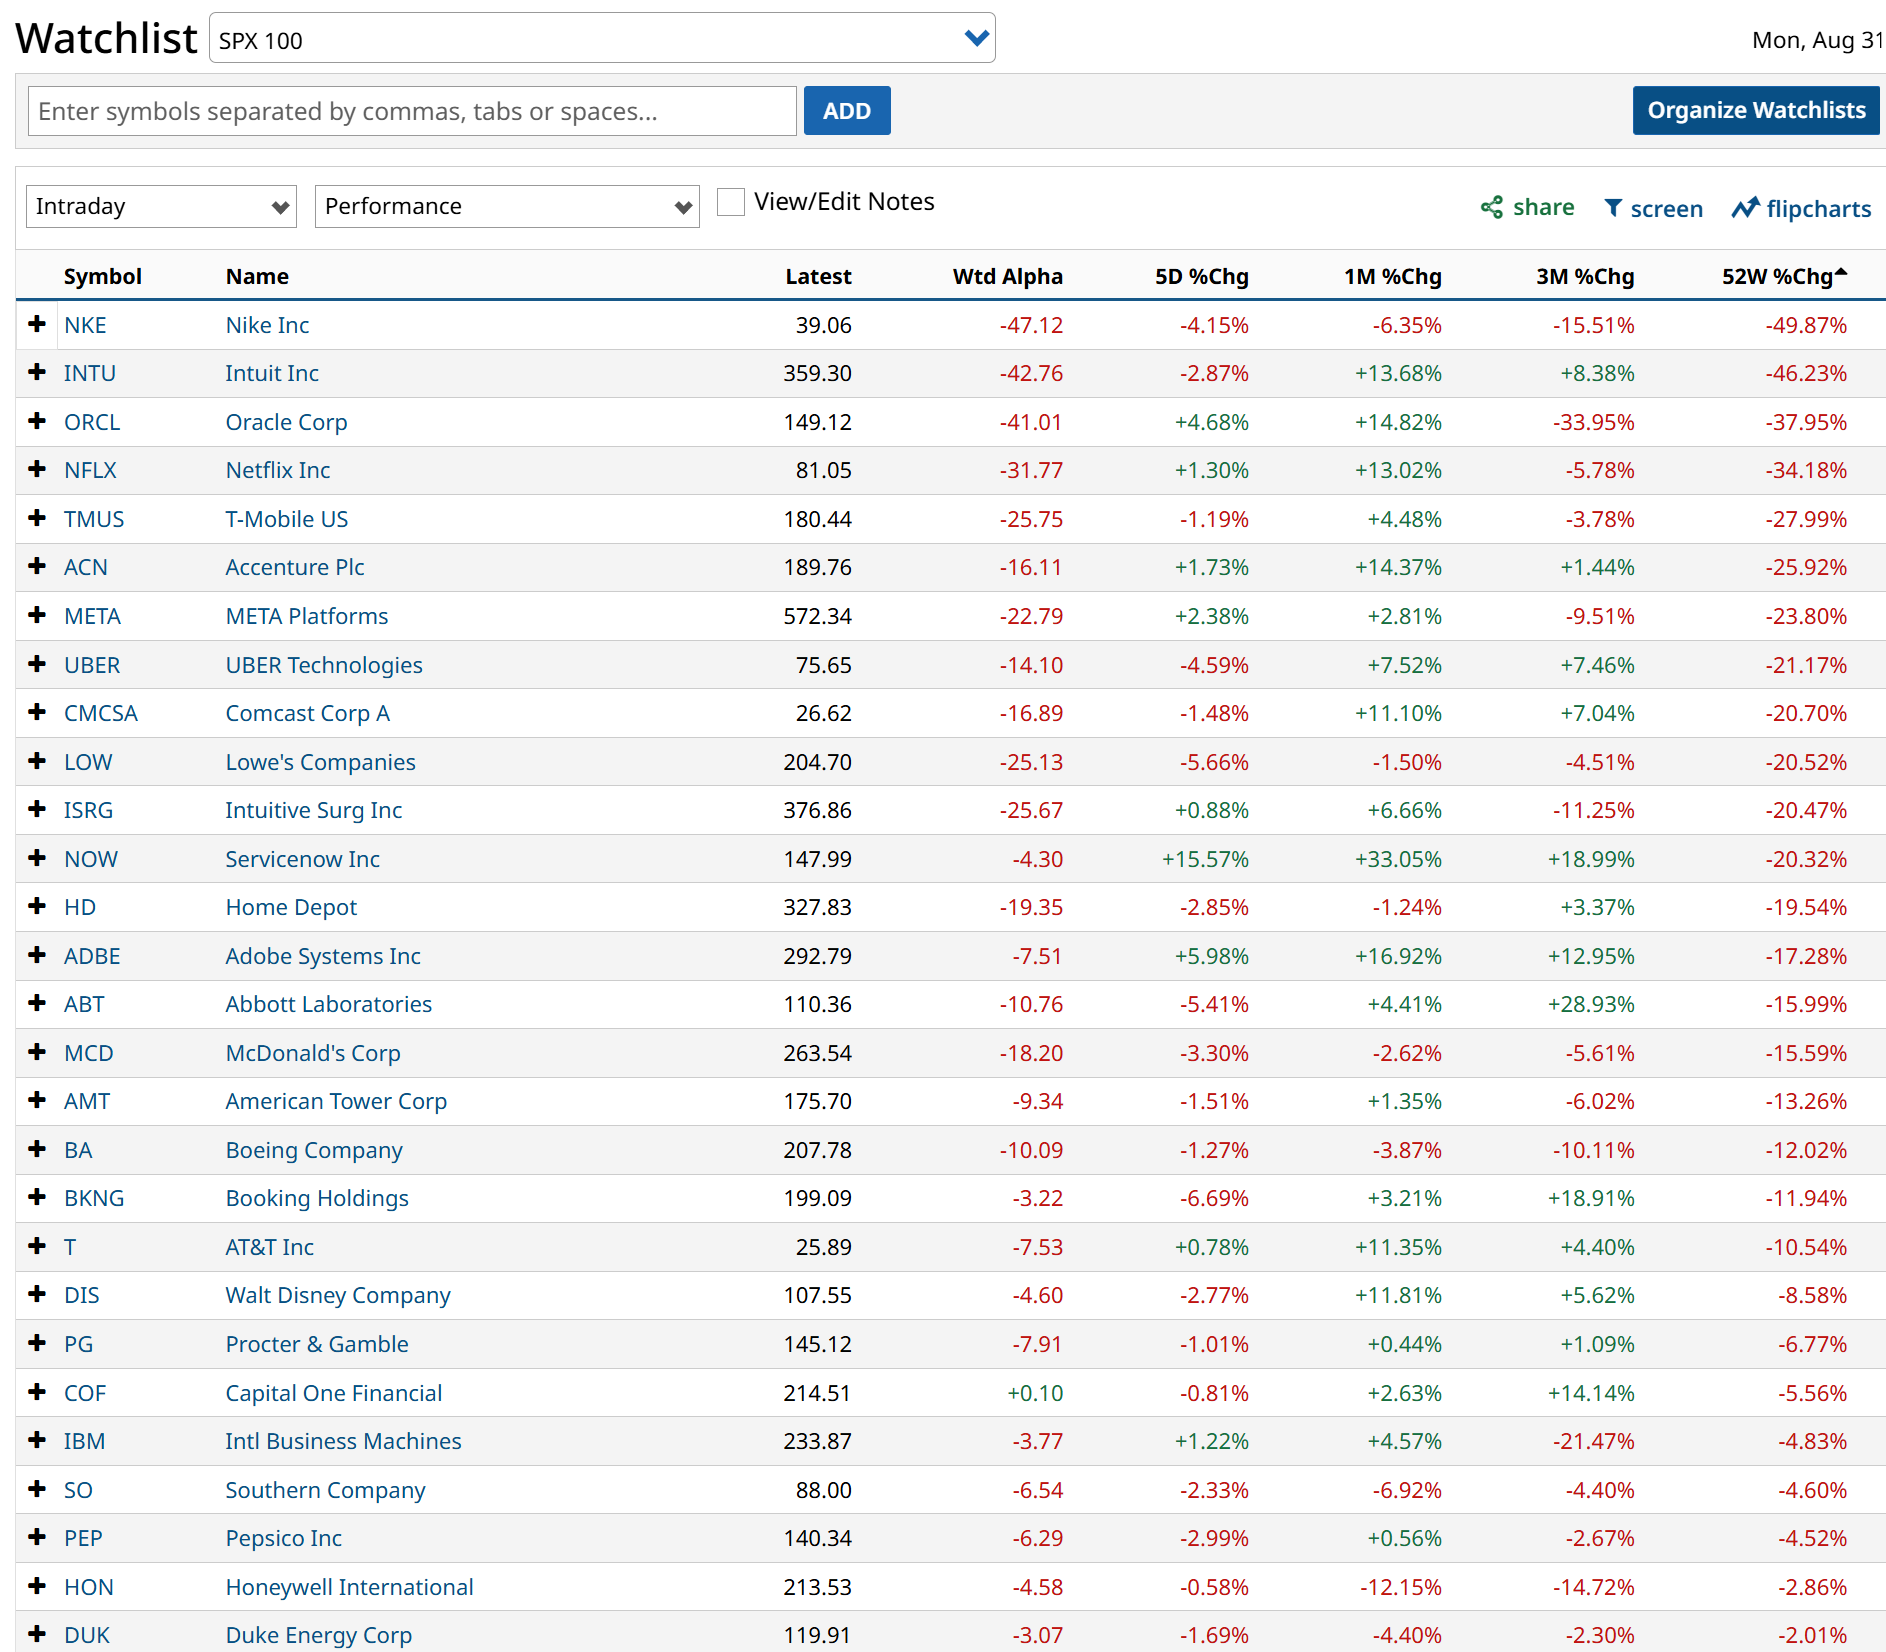
And that leads to what I’m showing above. This is a section of the S&P 100, the biggest 100 stocks. This is where many of the giant winners of the past 52 weeks come from. However, as we see in the column to the far right, there have been plenty of big stocks mixed into diversified portfolios, which have caused a lot of reversals of fortune. Literally.
This is not a case of a “bad market,” but of one where whipsaws happen at record speed. That leaves good old-fashioned stock diversifiers holding the proverbial bag.
Being wrong on a stock today is rarely a gradual learning experience. It is a wipeout of a good portion of the capital you put up. And while we all have winning trades, what I find more common than in decades past is that winners and losers more often cancel each other out. That is, unless you had a premeditated focus on the Magnificent 7 stocks about four years ago. If so, terrific! Now, what’s the encore?
The downfall of investors in this part of the market cycle is likely to be a lack of strict risk management rules. That, and the recognition of how markets now operate. That’s why we put in a lot of effort here to cover both sides of the bid/offer equation. These ain’t our parents’ markets, that’s for sure.
Rob Isbitts is a semi-retired CIO, former fiduciary investment advisor, and Barchart columnist. Check out his other work at ETFYourself.com (featuring the Fresh Charts weekly trading post), and ROAR.PiTrade.com, helping investors to better-manage their own portfolios.
On the date of publication, Rob Isbitts did not have (either directly or indirectly) positions in any of the securities mentioned in this article. All information and data in this article is solely for informational purposes. For more information please view the Barchart Disclosure Policy here.