
U.S. Energy Stocks Facing Inflation Pressure Investors Should Research Now
With inflation readings on deck and energy costs shaped by conflict in the Strait of Hormuz, many investors are reassessing how exposed their portfolios are to price shocks and policy moves. The coming PPI and CPI reports could influence everything from company margins to valuations, which makes this a moment to pay attention rather than sit it out. This article walks through three U.S. energy sector stocks linked to these forces and explains how the same macro story can play out differently for each one.
The three stocks below are just a starting sample from this theme, and the full screen surfaced 19 more U.S. energy companies with similarly interesting stories that are not covered here. To size up the wider opportunity set, head straight to the U.S. Energy Sector Stocks screener to identify, compare, and analyze the higher conviction ideas that fit your own approach.
Tidewater (TDW)
Tidewater is a Houston based offshore services company that supplies vessels and marine support to oil, gas, and offshore wind projects, which links it closely to the U.S. Energy Sector Stocks theme as offshore exploration and production activity responds to changing energy prices. Revenue is spread across vessel operations in Europe/Mediterranean at about $365 million, West Africa at about $337 million, the Americas at about $259 million, Asia Pacific at about $190 million, the Middle East at about $183 million, plus around $12 million from other operating revenue. The company has a market cap of about US$4.7b, putting it toward the larger end of the offshore services space covered by this screener.
Rising energy prices and renewed offshore spending put Tidewater in focus because its vessels are essential for getting offshore projects drilled, maintained, and eventually decommissioned. Tight vessel supply, improving margins and recent M&A that expands its Brazil footprint point to a business that could benefit if offshore demand stays firm. At the same time, conflict related fuel and crew costs, reliance on cyclical offshore markets, and higher external funding keep risk on the table. For investors who want direct exposure to offshore activity rather than just oil producers, Tidewater offers a focused way into that theme without the whole story being obvious at first glance.
Tidewater’s offshore reach and tight vessel supply can look like a simple leverage to energy prices, yet that headline story may miss how funding needs and regional exposure really interact. To see how those pieces fit together and where they could strain, walk through the 4 key rewards and 1 important warning sign

Cactus (WHD)
Cactus gives you direct exposure to onshore drilling and production activity because its engineered wellheads and pressure control gear are installed on unconventional oil and gas wells when rigs are turning and frac crews are working. Most of its revenue, about US$991 million, comes from the Pressure Control segment, with a further US$375 million from Spoolable Technologies that supplies FlexSteel pipe for gathering and production lines, and a small intersegment elimination. With a market cap around US$5.7b, Cactus is one of the larger pure play U.S. energy services stocks tied to upstream capital spending and field activity.
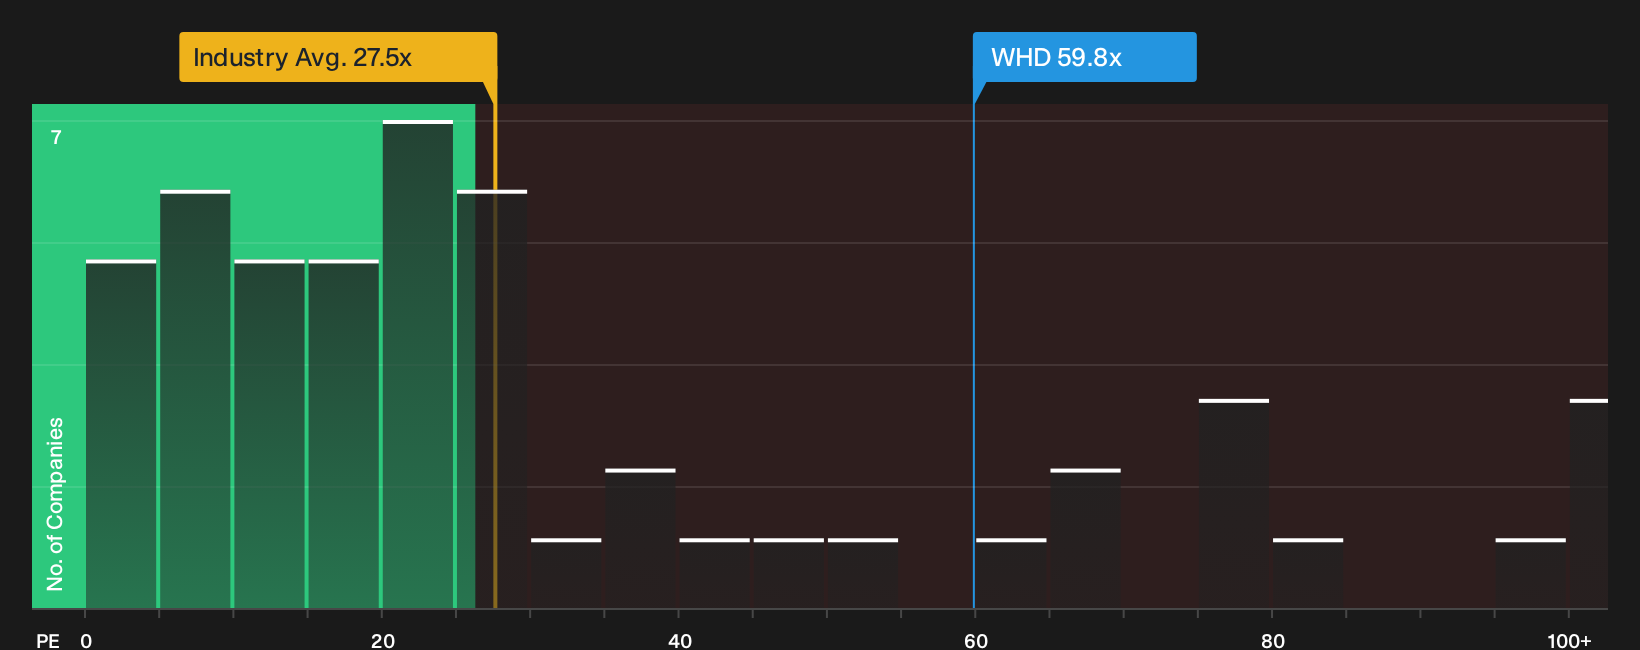
Investors looking at energy as an inflation hedge may find Cactus interesting because it sells the equipment producers need when they step up drilling and completion work in response to higher oil and gas prices. Its Pressure Control and FlexSteel pipe businesses are built around efficiency and field service support, which can matter when customers are watching both costs and uptime. At the same time, Cactus is wrestling with higher input and labor costs and does not always have unlimited room to lift prices, as management commentary on past inflation pressures makes clear. There is also the question of how much you are paying for this exposure today given a rich P/E and recent insider selling. The key issue for investors is whether Cactus can leverage its growing international footprint and product strengths to support margins in an environment where inflation, interest rates and activity levels continue to shift.
Cactus is built around field efficiency, yet investors keep circling back to rich P/E multiples and insider selling. To see how that trade off really stacks up, walk through the 2 key rewards and 2 important warning signs
RPC (RES)
RPC is tightly linked to the U.S. Energy Sector Stocks theme because it supplies the pressure pumping, cementing, coiled tubing, wireline, and rental tools that oil and gas producers rely on when they drill, complete, and maintain wells. Most of its roughly US$1.8b in revenue comes from the Technical Services segment at about US$1.7b, with around US$89 million from Support Services rental tools and related services. The company has a market cap of about US$1.4b, which puts RPC in the mid cap bracket of oilfield service providers screened for this theme.
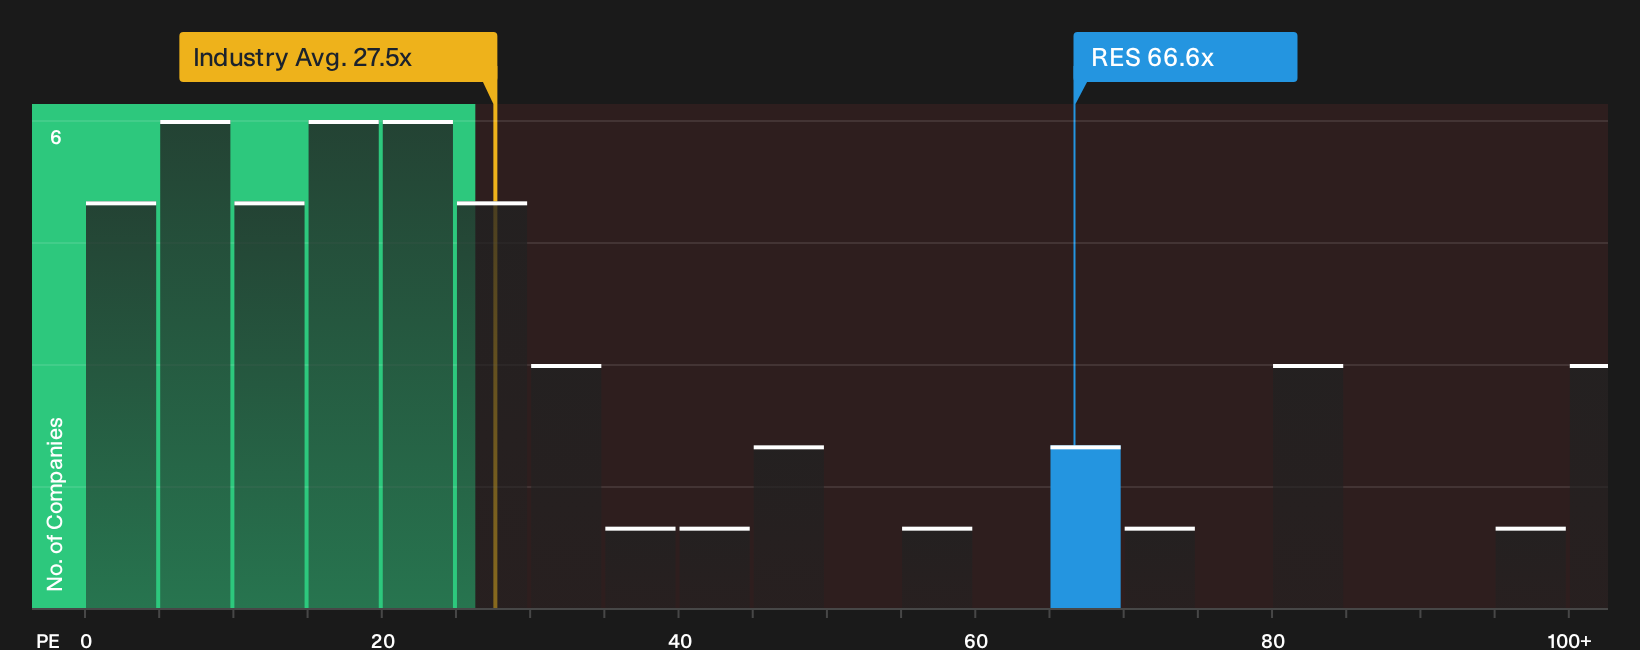
If you want direct exposure to how higher oil and gas prices can influence drilling and completion activity, RPC deserves a close look. The company relies on advanced tools and cleaner pressure pumping fleets to win work in North American shale, while a solid balance sheet and extended credit facility give it room to keep upgrading equipment and returning cash. On the other side of the ledger, thin margins, recent losses and a rich valuation put more pressure on management to turn forecast earnings growth into reality, especially with inflation, labor costs and customer budgets all in flux. The mix of theme alignment, balance sheet strength and execution risk means the more detailed story under the headline numbers really matters for investors.
RPC’s combination of cleaner fleets, execution risk and valuation questions hints at a story investors may be misreading. The next step is unpacking the detailed 2 key rewards and 3 important warning signs.
Seeking Fresh Alternatives For Your Curiosity?
Some stock stories only look obvious after the breakout. Use this moment while information is still fresh and under the radar for now. Consider researching ideas that interest you.
- Spot companies investors may be underestimating by scanning the 47 high quality undervalued stocks before prices reflect the full story and potential entry points change.
- Explore trends early by checking the 55 AI infrastructure stocks where demand for supporting technology may develop before most portfolios adjust.
- Target income ideas that may fit your objectives by reviewing the 11 dividend fortresses while yields and fundamentals are aligned with your criteria.
This article by Simply Wall St is general in nature. We provide commentary based on historical data and analyst forecasts only using an unbiased methodology and our articles are not intended to be financial advice. It does not constitute a recommendation to buy or sell any stock, and does not take account of your objectives, or your financial situation. We aim to bring you long-term focused analysis driven by fundamental data. Note that our analysis may not factor in the latest price-sensitive company announcements or qualitative material. Simply Wall St has no position in any stocks mentioned.
Have feedback on this article? Concerned about the content? Get in touch with us directly. Alternatively, email editorial-team@simplywallst.com