
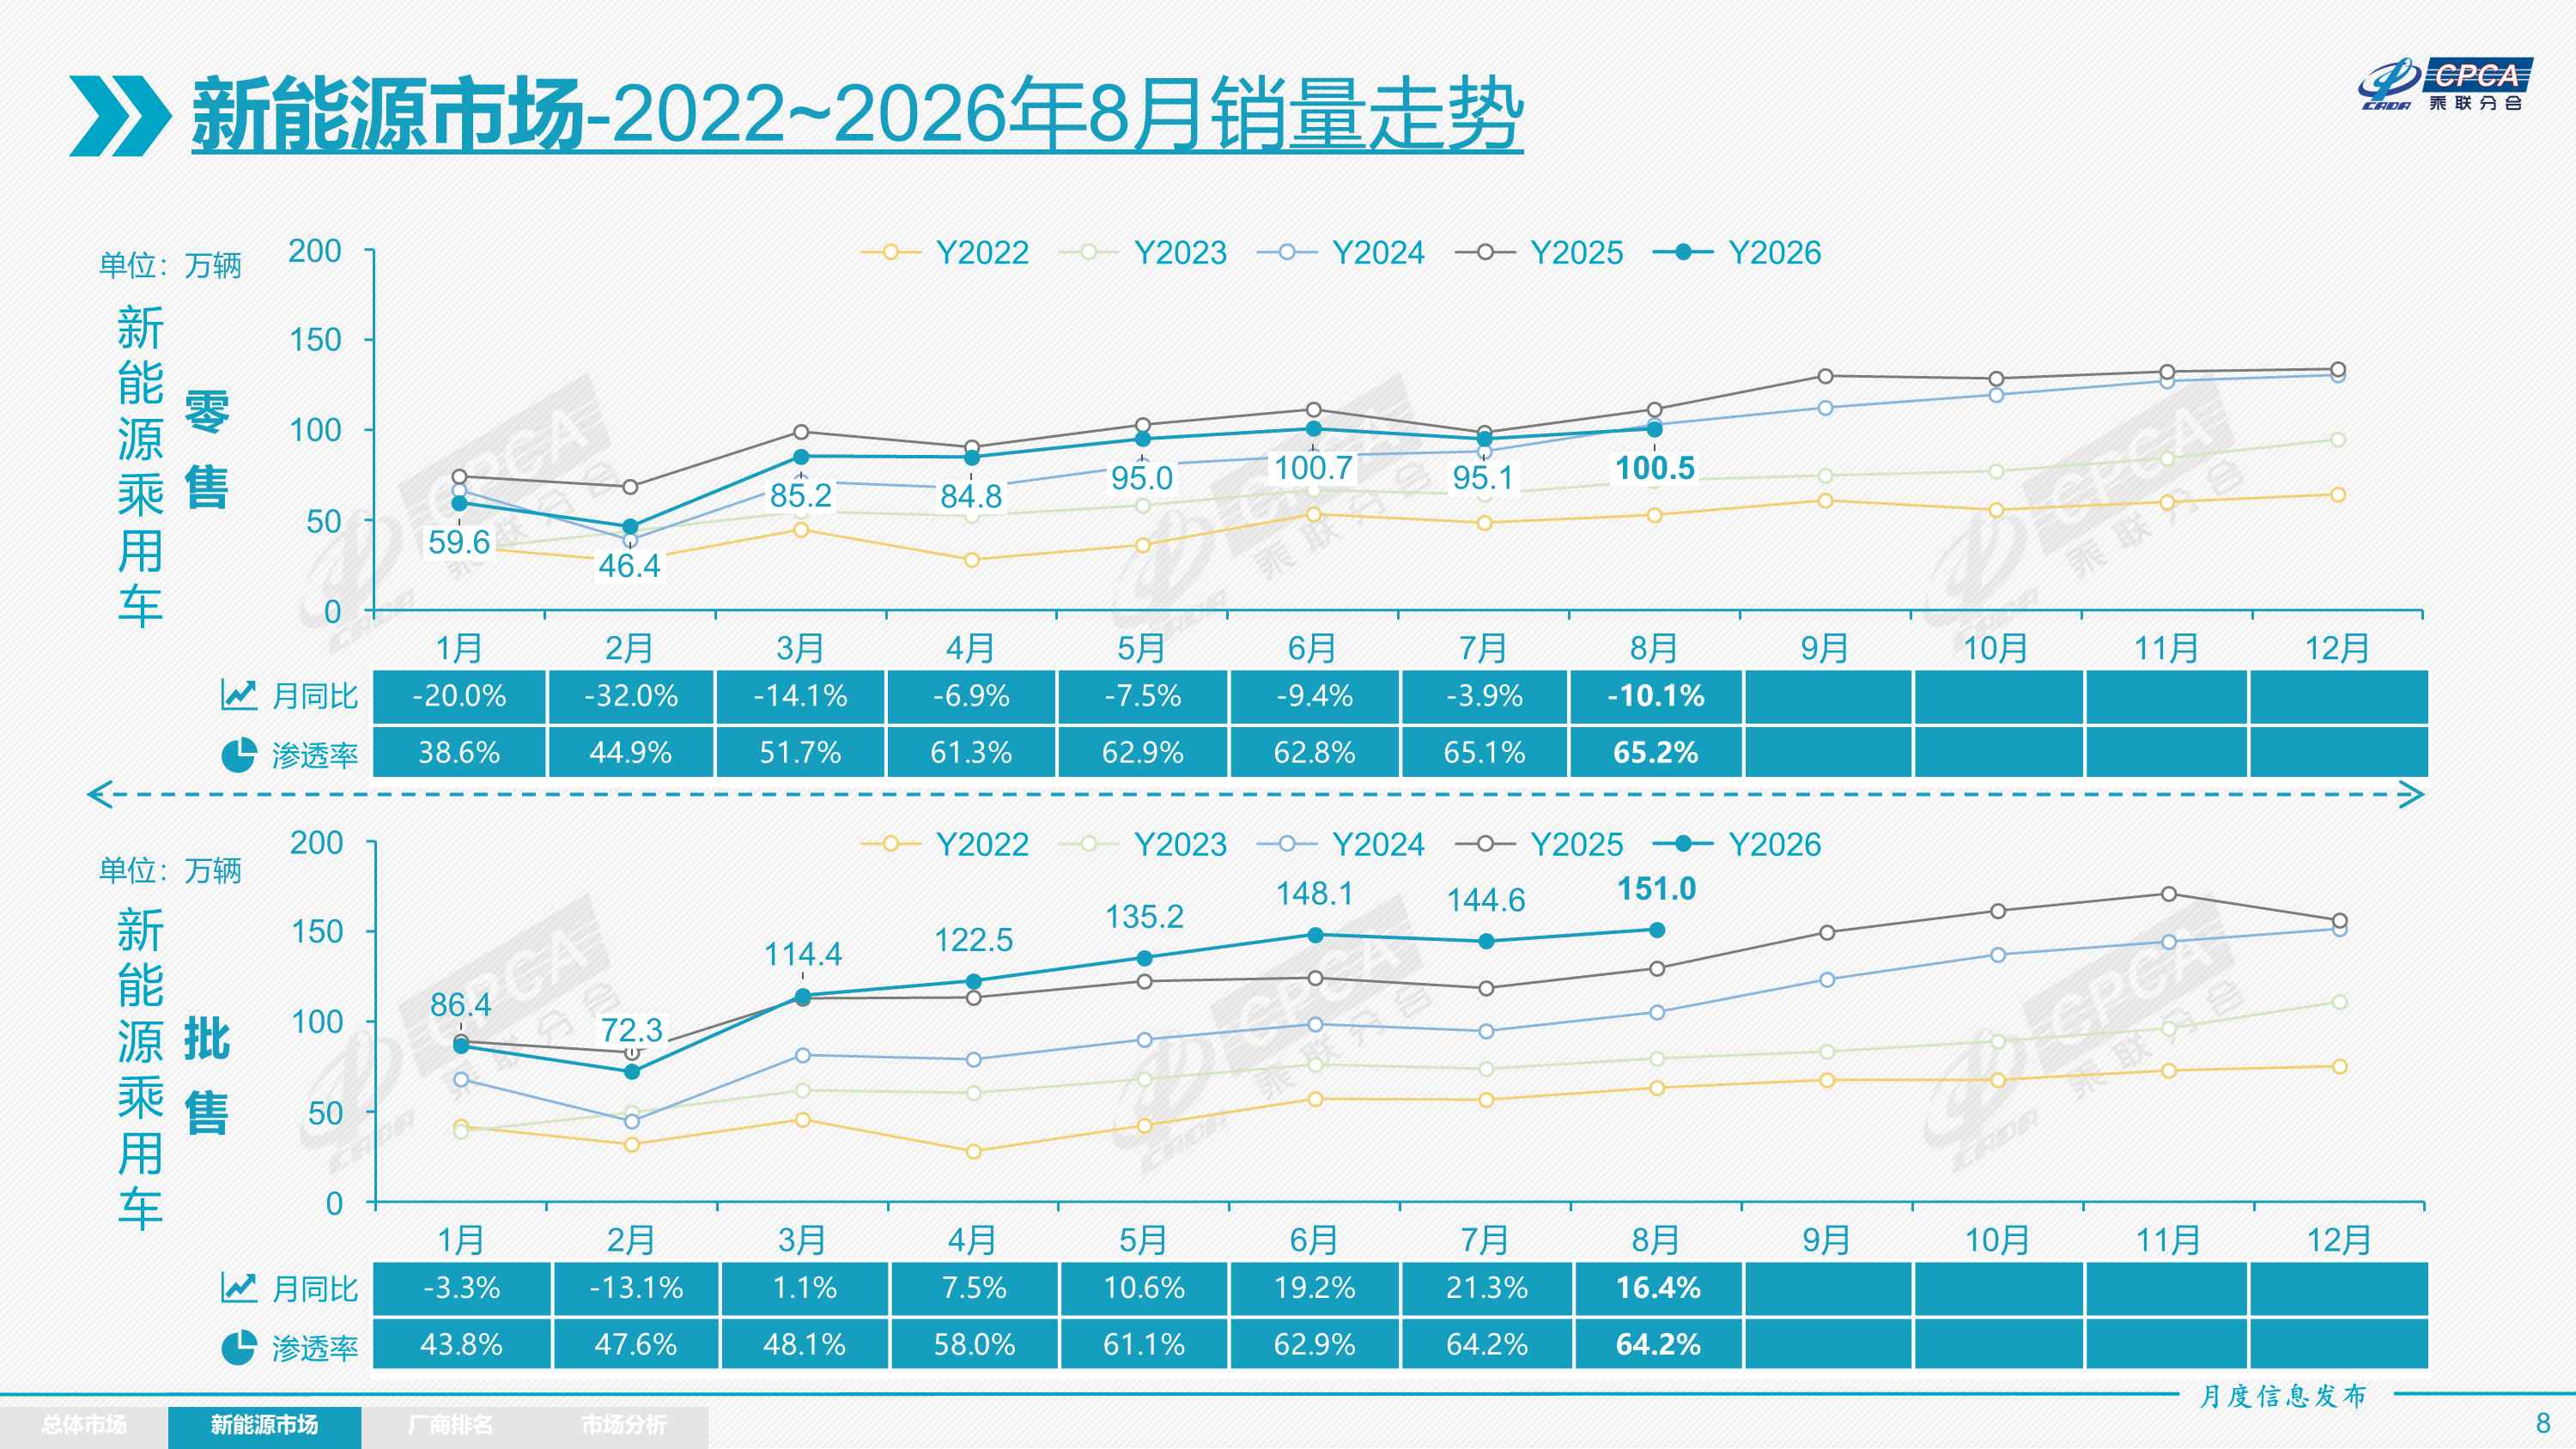
Passenger Link Branch: Retail sales of 1.05 million new energy passenger vehicles fell 10.1% year-on-year in August, up 5.7% month-on-month
The Zhitong Finance App learned that the Passenger Transport Association released the “National Passenger Vehicle Market Analysis for August 2026", which mentioned that in August, production of new energy passenger vehicles reached 1,528,000 units, up 19.2% year on year and 5.0% month on month. The cumulative production of new energy passenger vehicles reached 9.758 million units in January-August, an increase of 9.8% over the previous year. In August, wholesale sales of new energy passenger vehicles reached 1.51 million units, up 16.4% year on year, up 3.9% month on month; in January-August, wholesale sales of new energy passenger vehicles reached 9.778 million units, up 9.1% year on year. Wholesale sales of conventional fuel passenger cars reached 840,000 units in August, down 29% year on year and up 5% month on month. In August, the NEV passenger car market retailed 1.05 million vehicles, down 10.1% year on year and up 5.7% month on month; in January-August, the NEV passenger car market retailed 6.674 million vehicles, down 12.1% year on year. In August, 540,000 conventional fuel passenger cars were retailed, down 40% year on year and up 5.1% month on month.
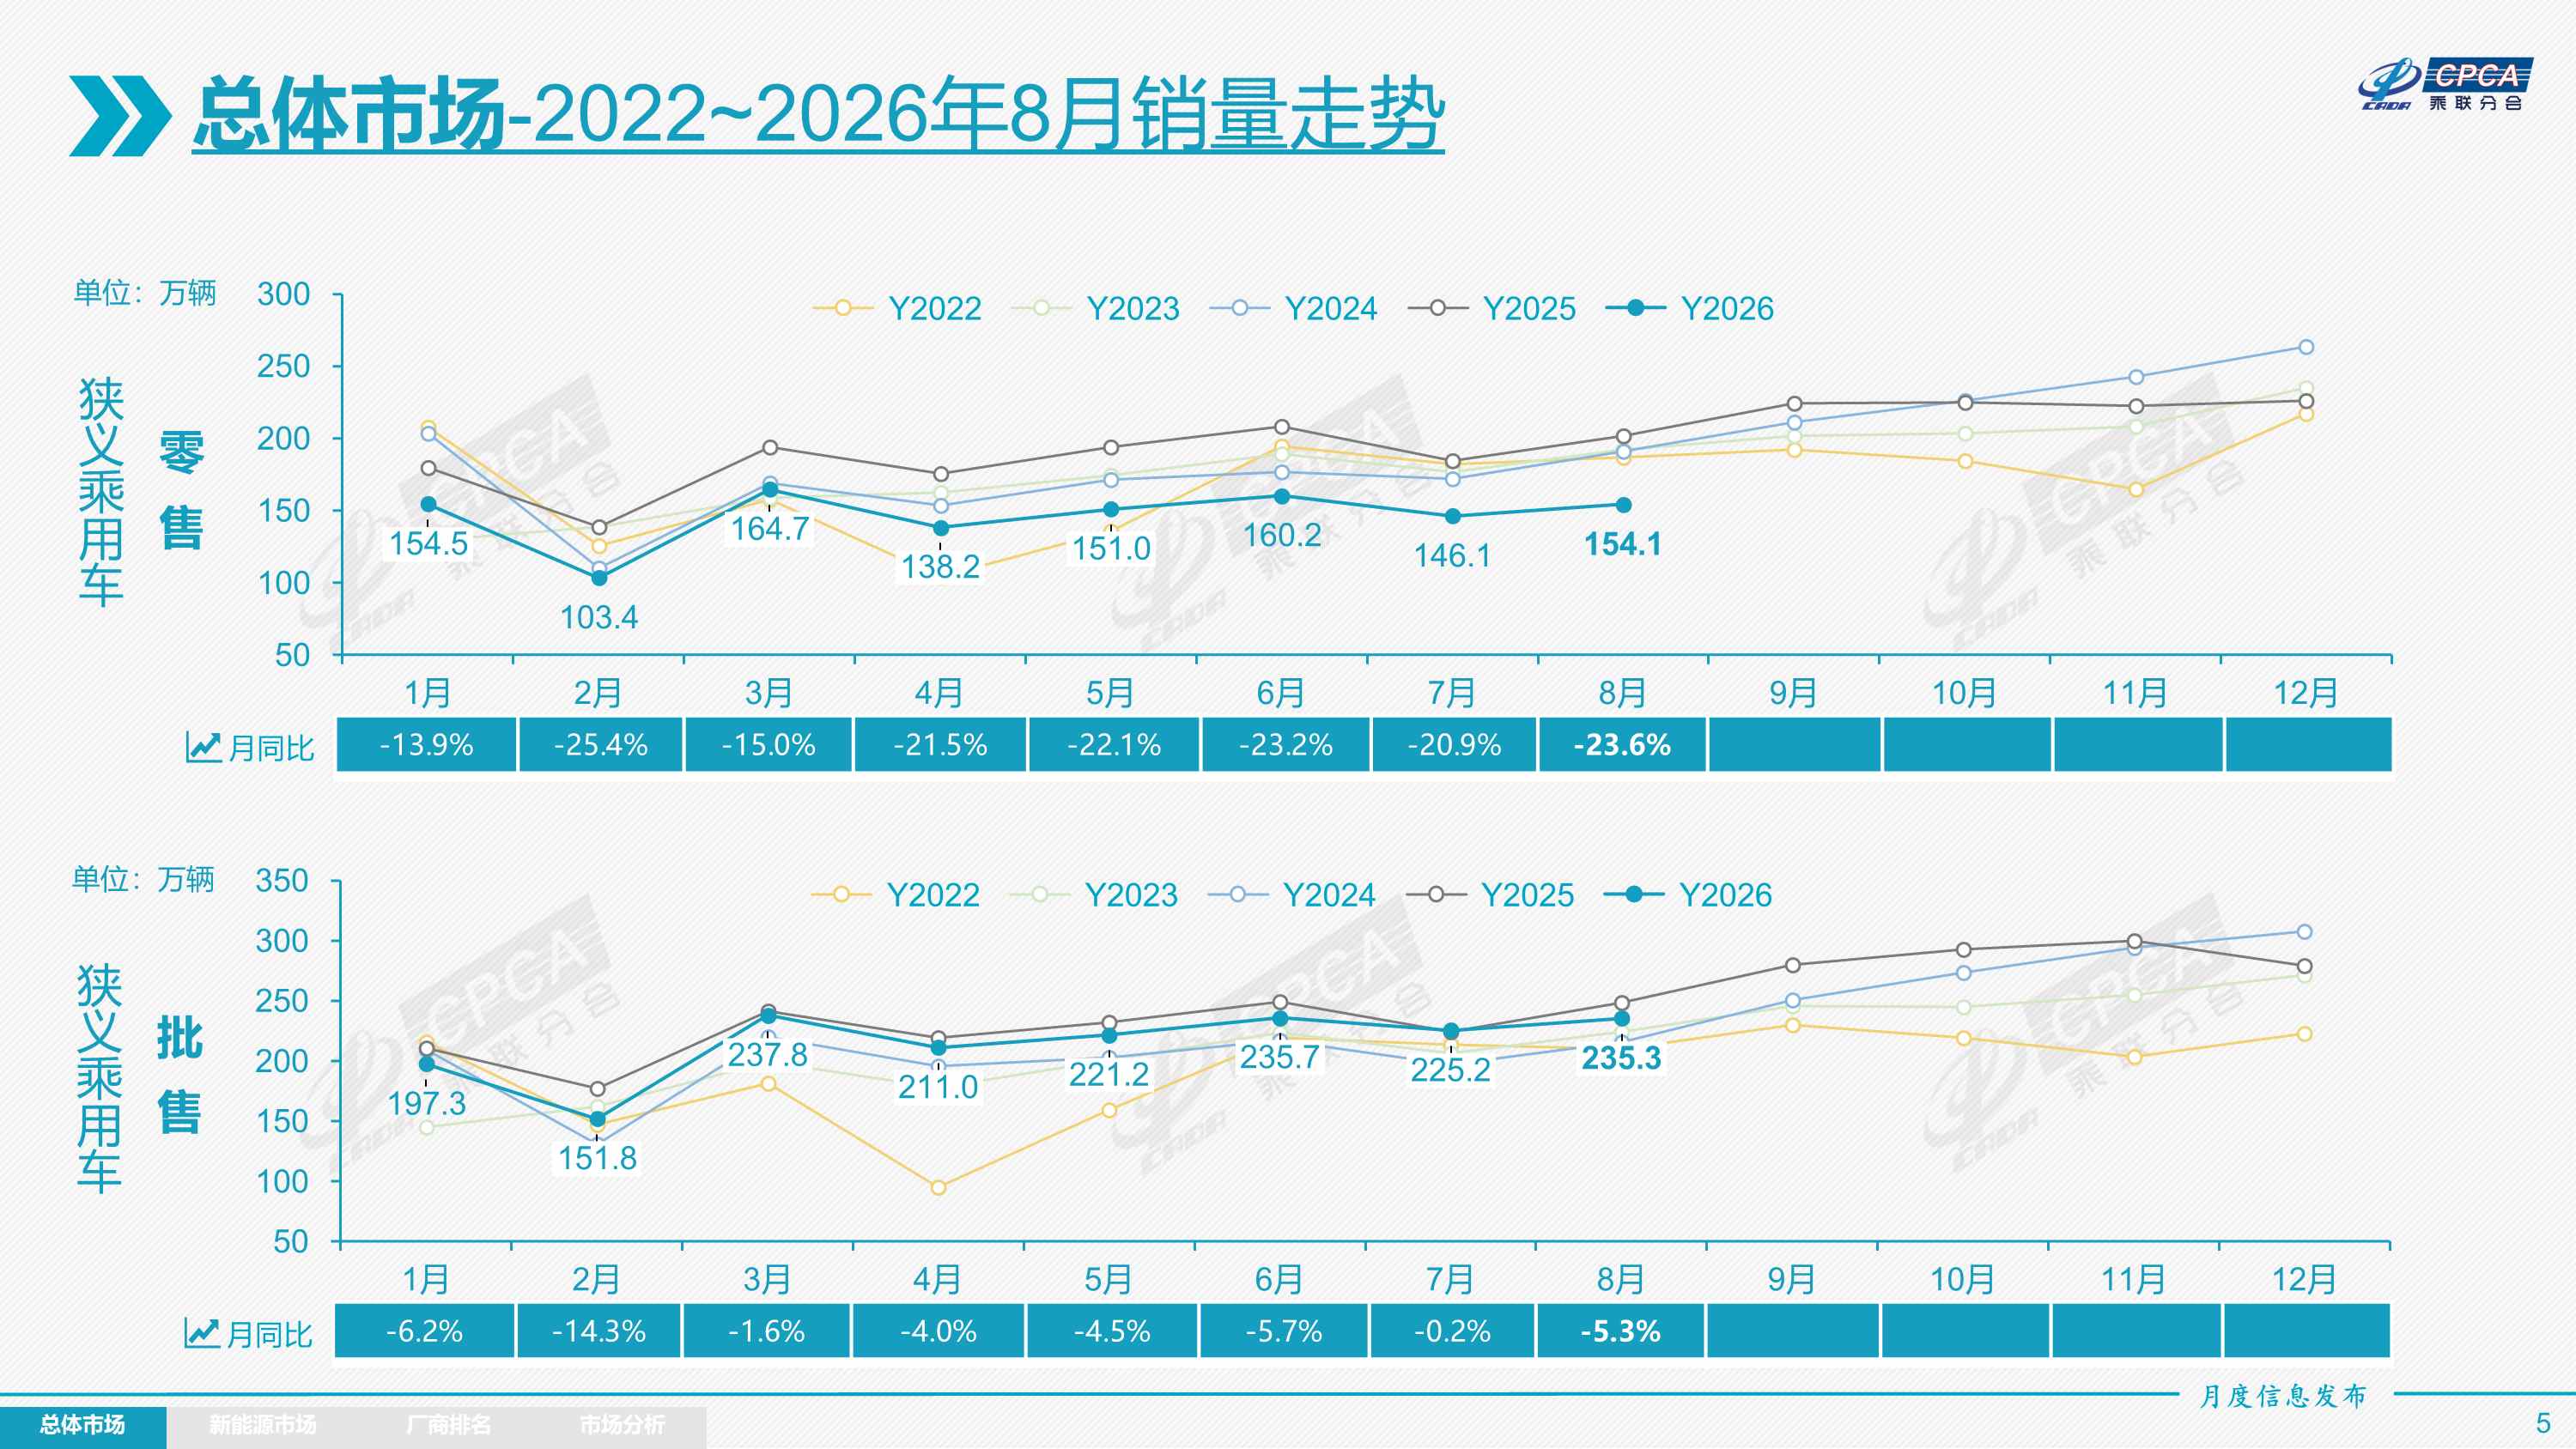
In August 2026, the national passenger car market retailed 1,541 thousand vehicles, down 23.6% year on year and up 5.5% month on month; since this year, 11.716 million vehicles have been sold, down 20.8% year on year. In August, the domestic passenger car market showed an operating trend of “weak total repair, month-on-month strengthening, and extreme structural differentiation”. The late stage of the off-season was “building strength”, and the structural adjustment of the industry was further deepening. The Chuanglian Forecast Team's forecast index for July was 19%, the July satisfaction rate assessed in mid-August was 17%, and our August forecast index was 12%, which is at the bottom of history. Satisfaction with the mid-September release is expected to improve.
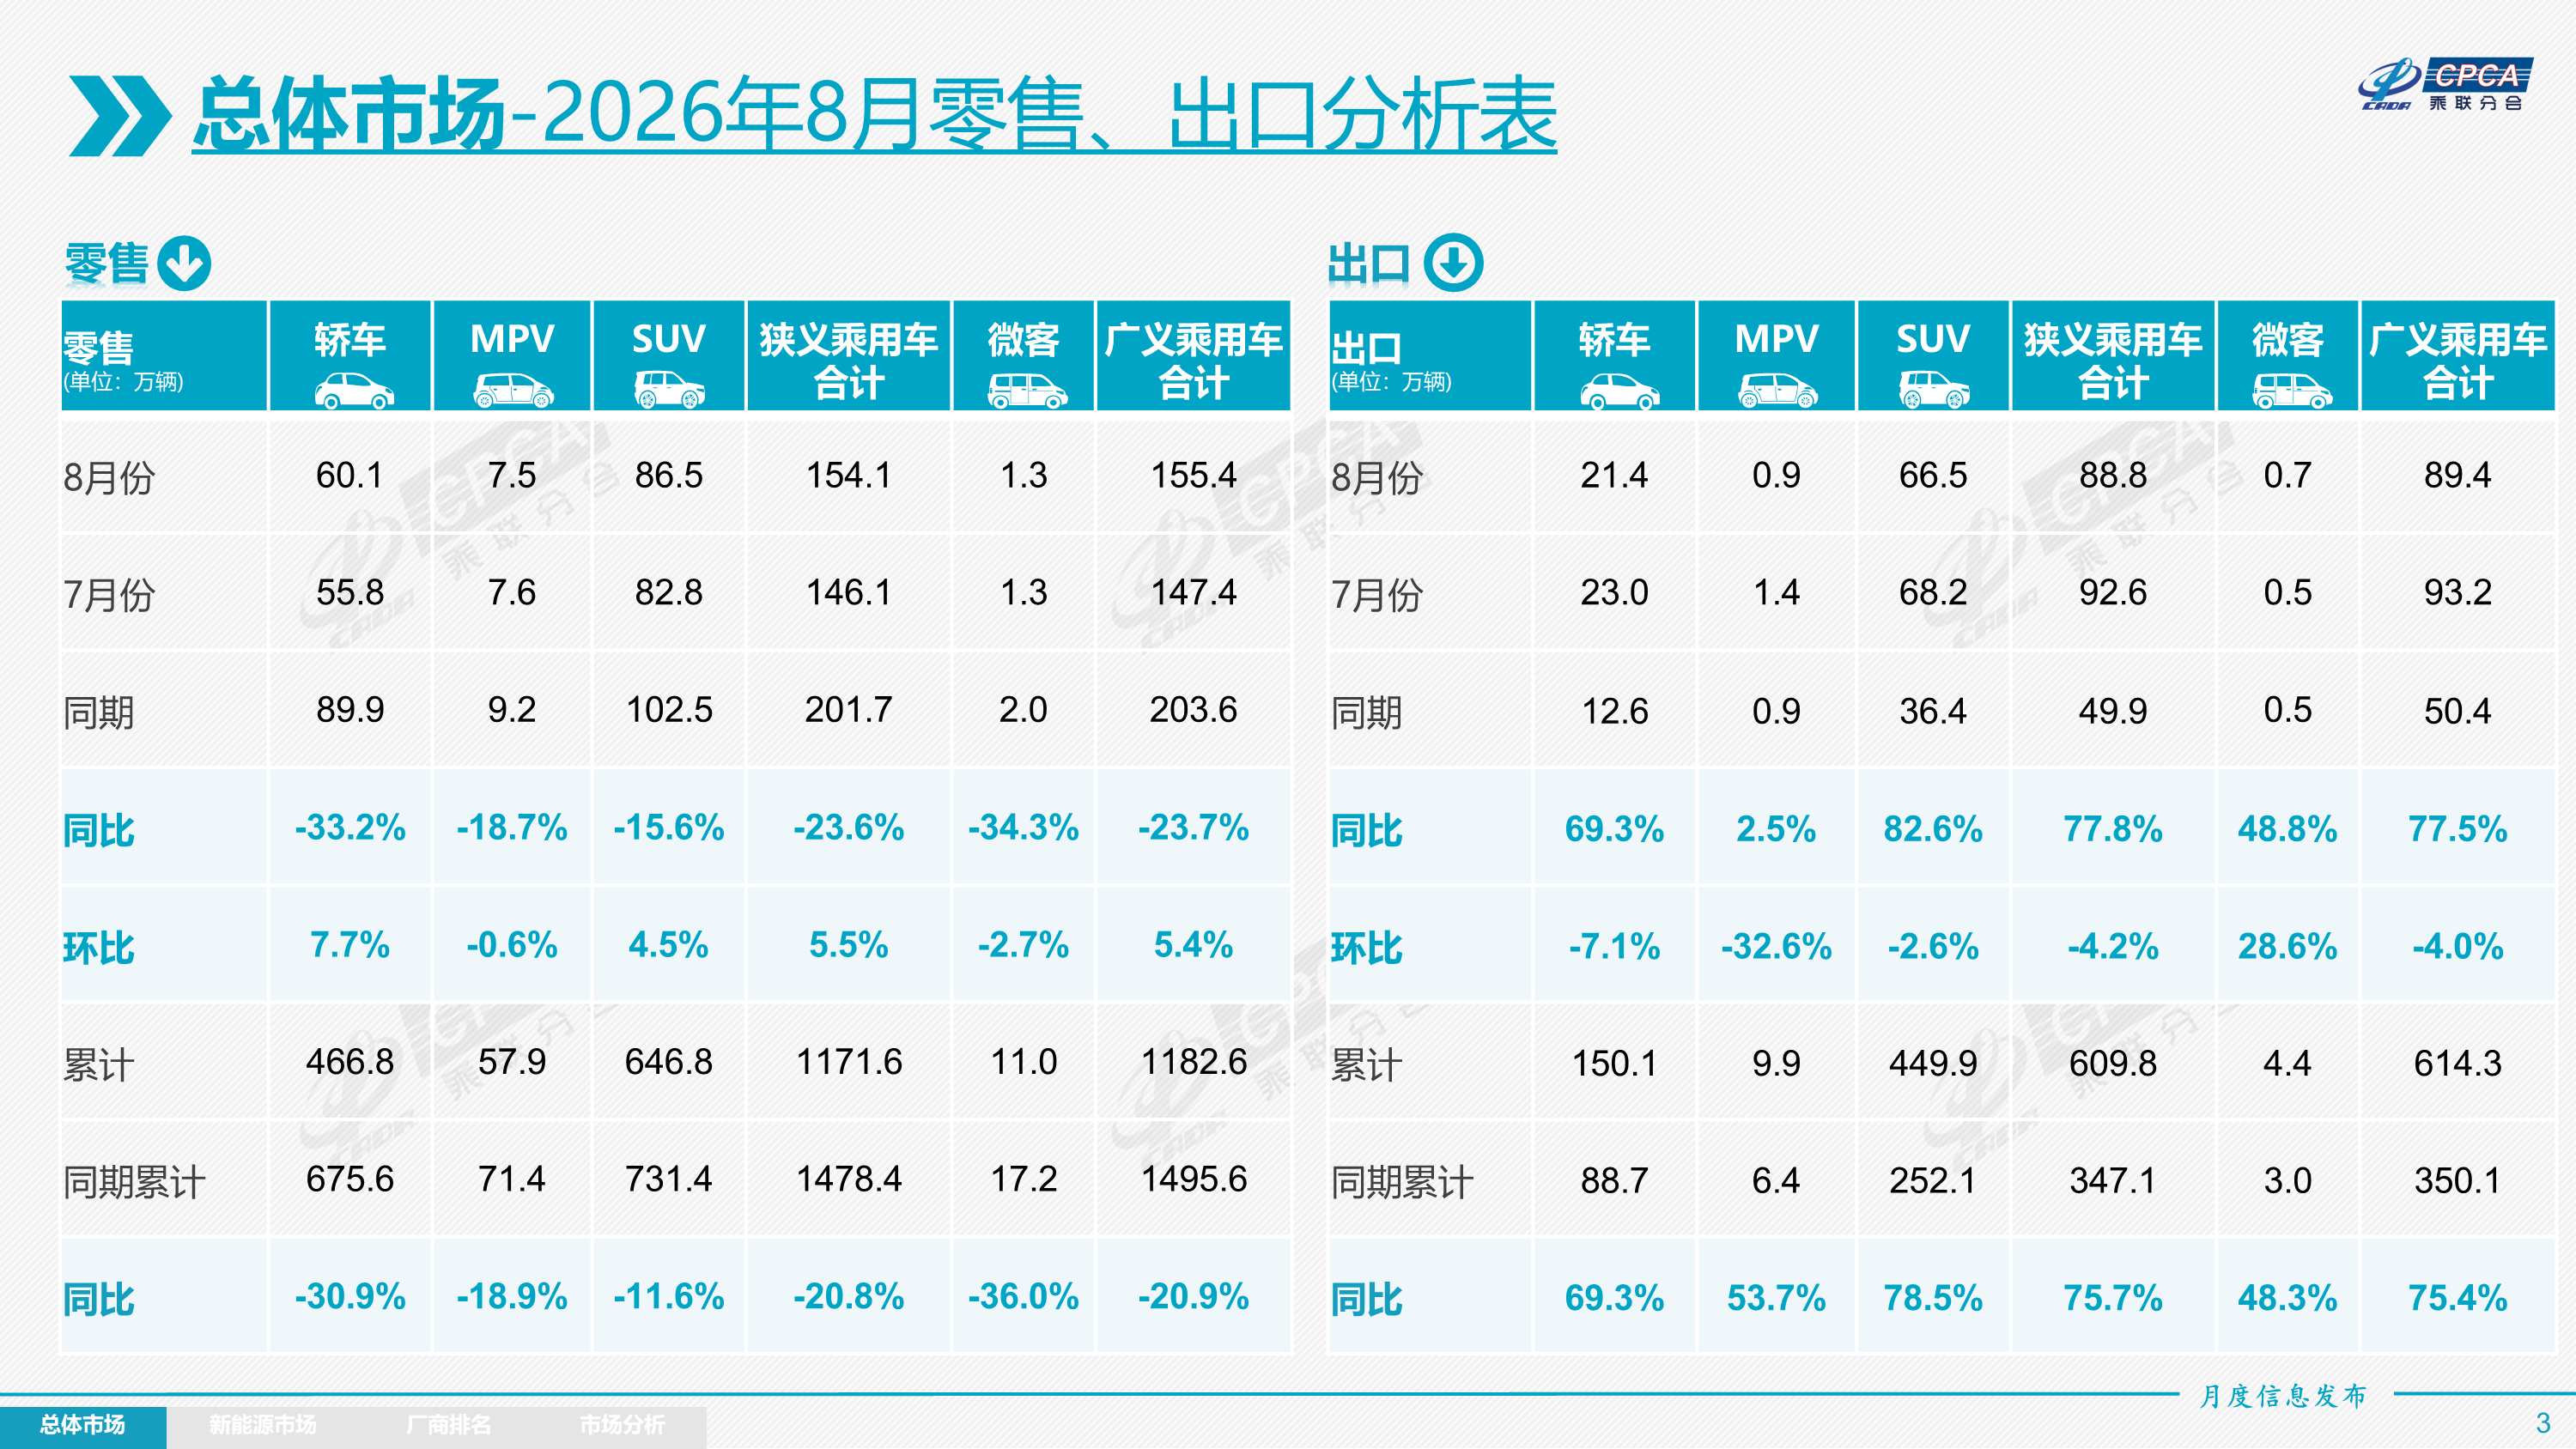 Retail sales in the auto market rebounded 5.5% month-on-month in August 2026, as a result of a combination of factors such as high oil price suppression, weak macroeconomic conditions, heated policy expectations, and the drive of the Chengdu Auto Show. Geographical conflicts continue to plague navigation in the Strait of Hormuz, driving international oil prices to remain high and volatile. The cumulative increase in domestic gasoline prices in 2026 has exceeded 1,720 yuan/ton. In particular, since the end of July, it has risen 180 yuan, which has greatly increased the cost of fuel vehicles, and domestic fuel passenger vehicle consumption demand continues to shrink sharply. The manufacturing PMI rebounded 0.6% to 49.8% month-on-month in August, and is still below the boom and bust line. Although the marginal domestic demand for terminals picked up, its strength was limited. The high temperature holiday in early to mid-August curtailed the flow of terminal-to-store customers, the late Chengdu Auto Show led to a recovery in market popularity, and the monthly impulse drove the average daily retail repair. Terminal orders and passenger flow showed a trend of low and back.
Furthermore, after the implementation of the new national standard for new energy safety, compliant products were intensively and iteratively listed, and the rise in the technical threshold drove the industry to shift from “price internal volume” to “value competition.” Combined with the July Politburo meeting, it was clear that fiscal strengthening, increasing domestic demand, and continuing implementation of policies to promote consumption will provide bottom support for the car market. Therefore, this round of market downturn is a phased structural fluctuation, not a deterioration in industry trends.
Taken together, the passenger car market showed five distinct characteristics in August 2026:1. Total volume was repaired month-on-month but was still under pressure year on year; structural differentiation was extremely amplified. “Deep fuel cooling, strong new energy leadership” became the main line of the market, and high fuel prices continued to accelerate the pace of “oil and electricity substitution”; 2. Fuel vehicle retail contracted across the board. In August, fuel vehicle retail sales fell by more than 40% year on year, close to falling. 3. The penetration rate of new energy vehicles continued to break through a new high, falling 1050,000 year-on-year. 1%, up 5.7% month-on-month, penetration rate reached 65.2%, another record high; 4. Exports continued to play a supporting role, effectively stabilizing the wholesale and production capacity of car companies. In August, manufacturers sold 2.353 million vehicles, down only 5.3% year on year, up 4.5% month on month. Wholesale growth rate was 18.3 percentage points higher than retail; 5. Industry inventories continued to decline, high fuel prices clearly impacted fuel vehicles. Dealers were under high pressure to survive and confidence was insufficient, and the channel side continued to be pressured under the domestic “weak wholesale sales and weak retail” pattern.
In August, retail sales of fuel vehicles fell 40% year on year. Among them, pure fuel vehicles fell 45% year on year, and ordinary hybrid vehicles increased 10% year on year. Autonomy in fuel vehicles fell 45% year on year, mainstream joint ventures fell 40% year on year, and luxury fell 33% year on year, all of which were severely impacted by high fuel prices without discrimination.
In August, retail sales of new energy vehicles fell 10.1% year on year, with autonomous vehicles falling 11%, mainstream joint ventures increasing 35%, luxury falling 12%, and domestic retail sales of autonomous A00 class electric vehicles plummeted greatly due to unfavorable subsidy policies.
In August, independent brands sold 1.08 million vehicles, a year-on-year decrease of 19%, and a month-on-month increase of 4%. The domestic retail share of independent brands in the same month was 69.9%, an increase of 4.1 percentage points over the previous year. Overall, the performance of independent brands in the new energy market and export market is relatively stable.
In August, mainstream joint venture brands retailed 310,000 vehicles, a year-on-year decrease of 35% and a month-on-month increase of 5%. In August, the retail share of German brands was 12.5%, down 2.1 percentage points from the previous year, and the retail share of Japanese brands was 10.9%, down 1.4 percentage points from the previous year. The retail share of American brands in the market was 5.6%, down 0.04 percentage points from the previous year. Low-volume joint ventures are gradually recovering their vitality.
In August, 150,000 luxury cars were retailed, down 26% year on year and up 22% month on month. With the reasonable return of the guide price for luxury cars, the retail share of luxury brands was 10% in August, down only 0.3 percentage points from the previous year.
Exports: According to Passenger Link data, passenger car exports (including complete vehicles and CKD) were 888,000 units in August, up 77.8% year on year, down 4.2% month on month, accounting for 38% of passenger car manufacturer sales (41% last month, 20% in the same period in 2025). In August, new energy vehicles accounted for 58.4% of total exports, a sharp increase of 18 percentage points over the same period. In August, exports of independent brands reached 78,000 vehicles, an increase of 82% year on year; joint ventures and luxury brands exported 108,000 vehicles, an increase of 53% year on year.
Production: Passenger car production in August was 2.348 million units, down 4.5% year on year and up 5.7% month on month. In August, luxury brand production fell 24% year on year and increased 2% month on month; joint venture brand production fell 26% year on year, up 14% month on month; independent brand production increased 4% year on year, up 4% month on month.
Wholesale: In August, passenger car manufacturers across the country sold 2.353 million vehicles, down 5.3% year on year and up 4.5% month on month. Encouraged by the surge in exports, the year-on-year growth rate of passenger car wholesale in August was 18.3 percentage points higher than retail sales growth. In August, autonomous car companies wholesale 1.822 million vehicles, up 5% year on year and 5% month on month. Mainstream joint ventures wholesale 333,000 vehicles, a year-on-year decrease of 32% and a month-on-month increase of 6%. The wholesale volume of luxury cars was 200,000 units, down 24% year on year and 3% month on month.
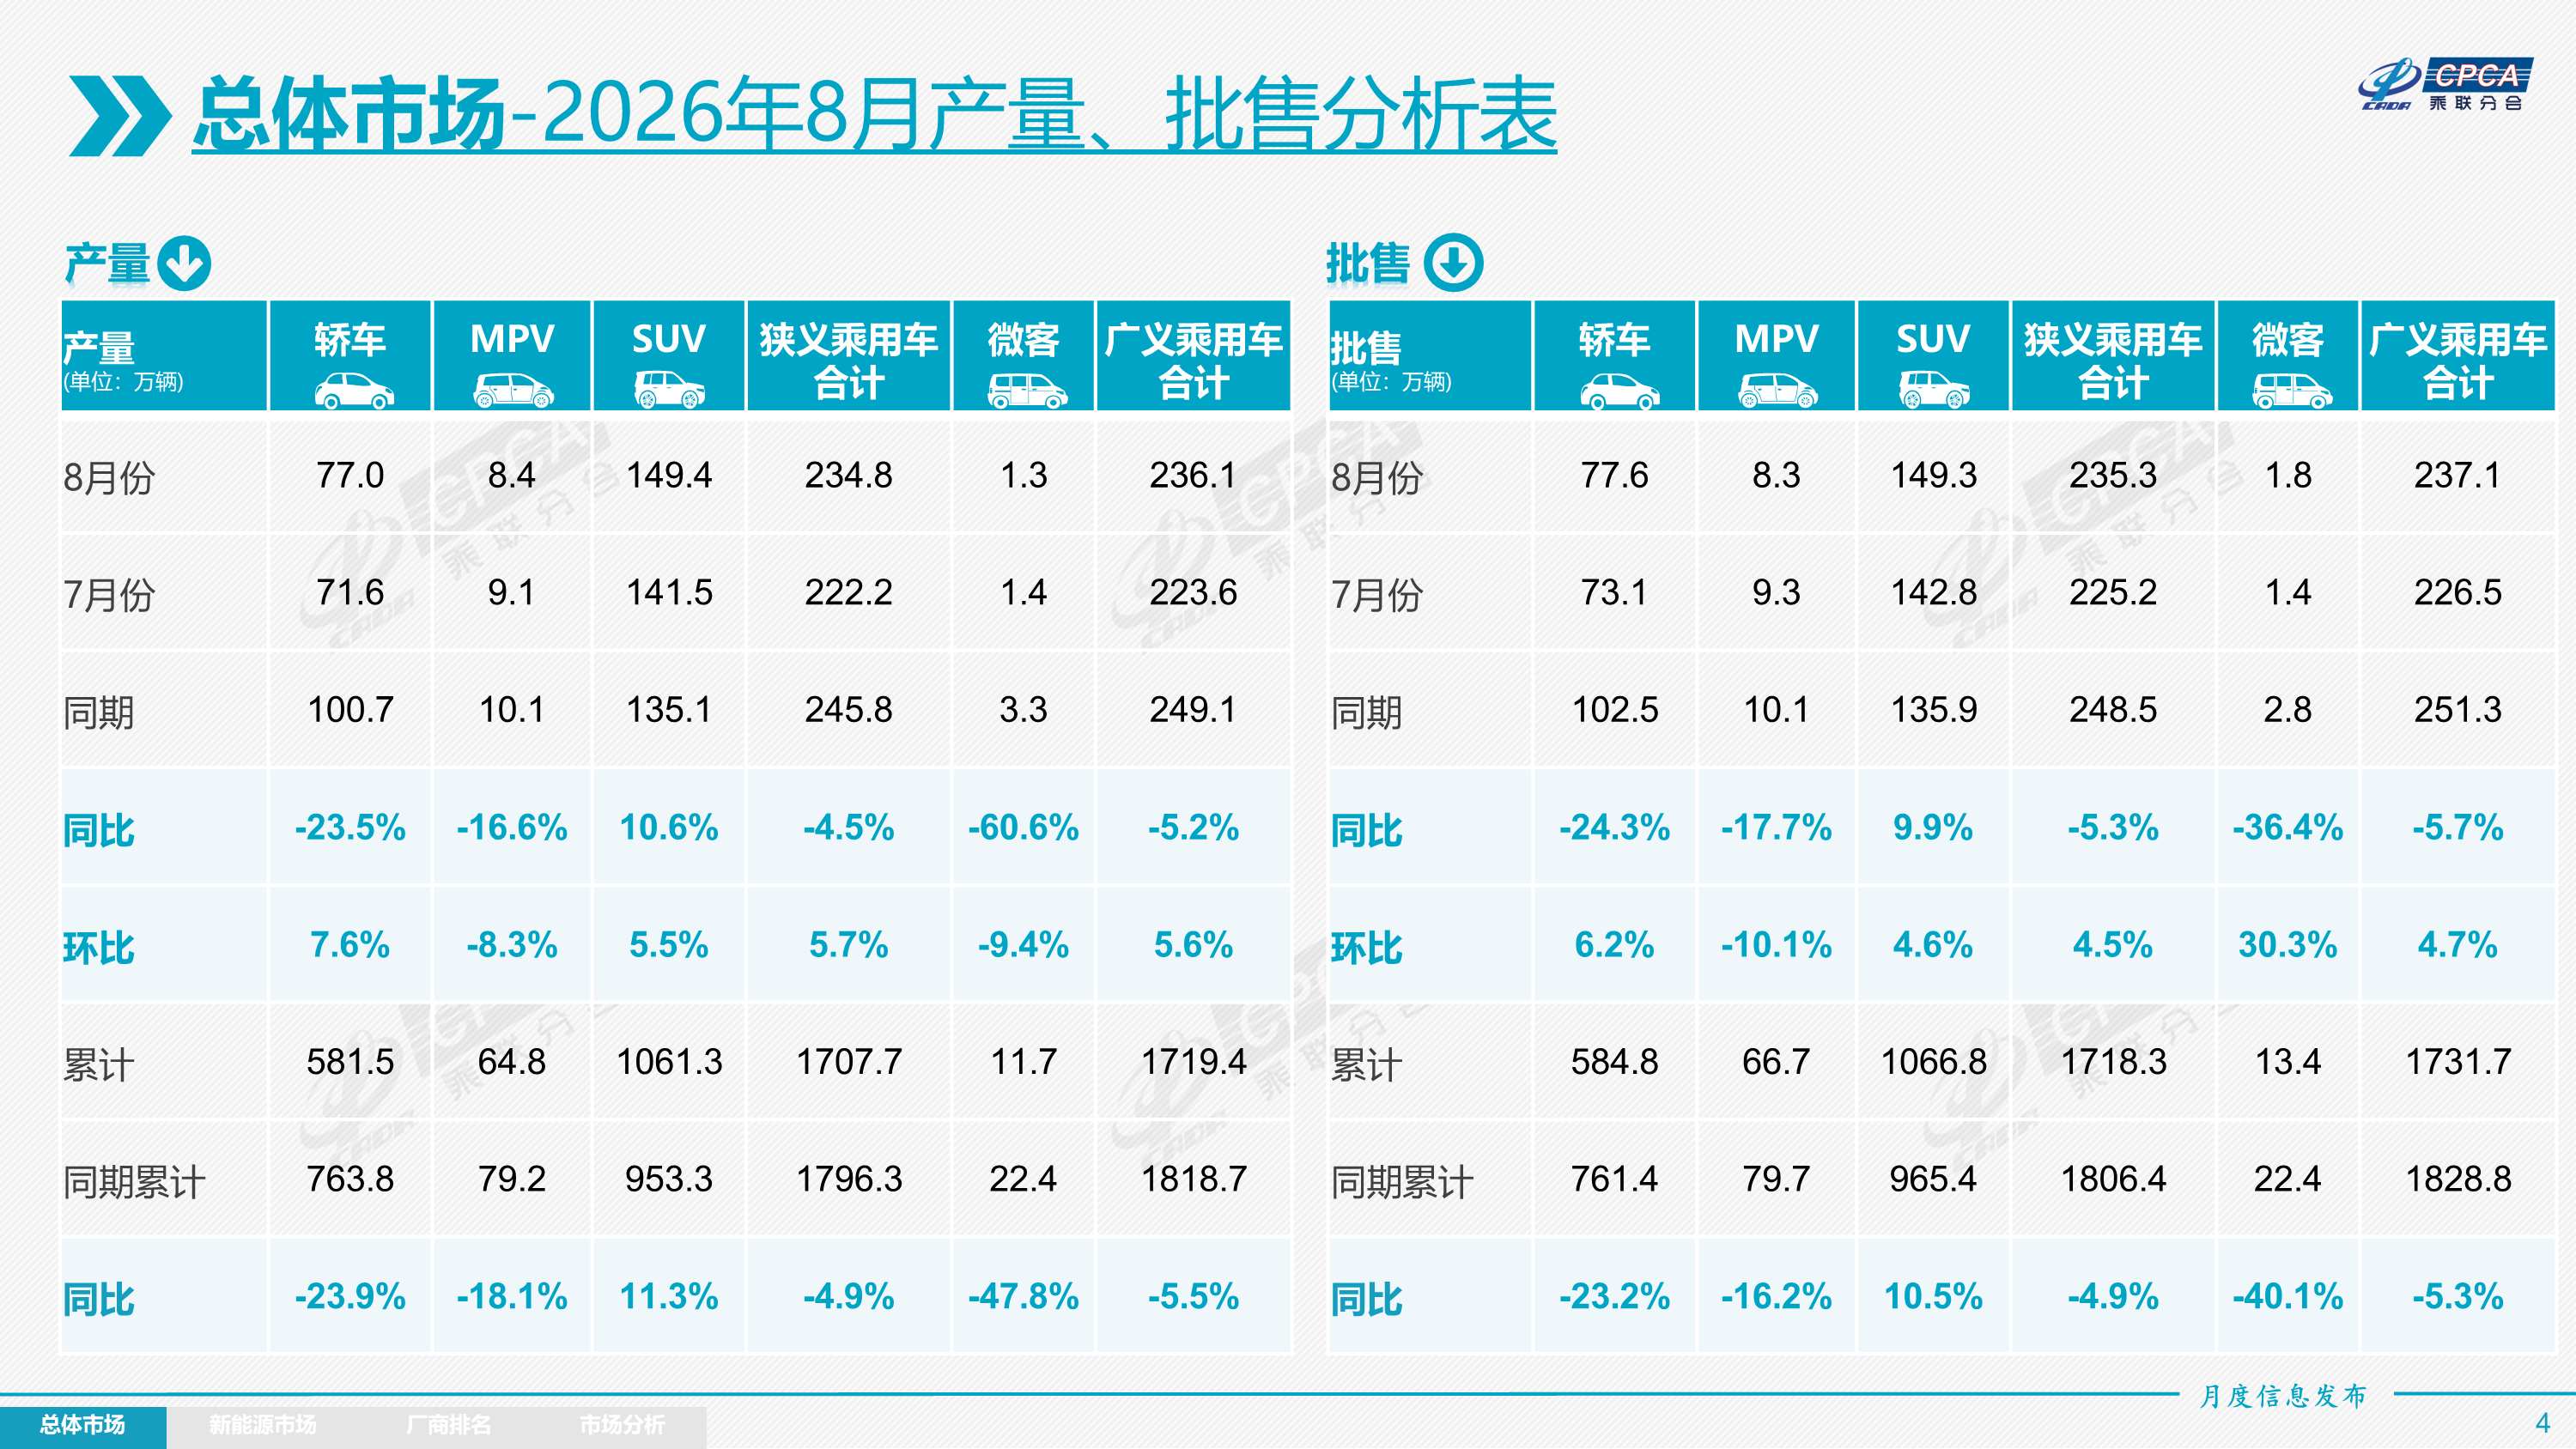
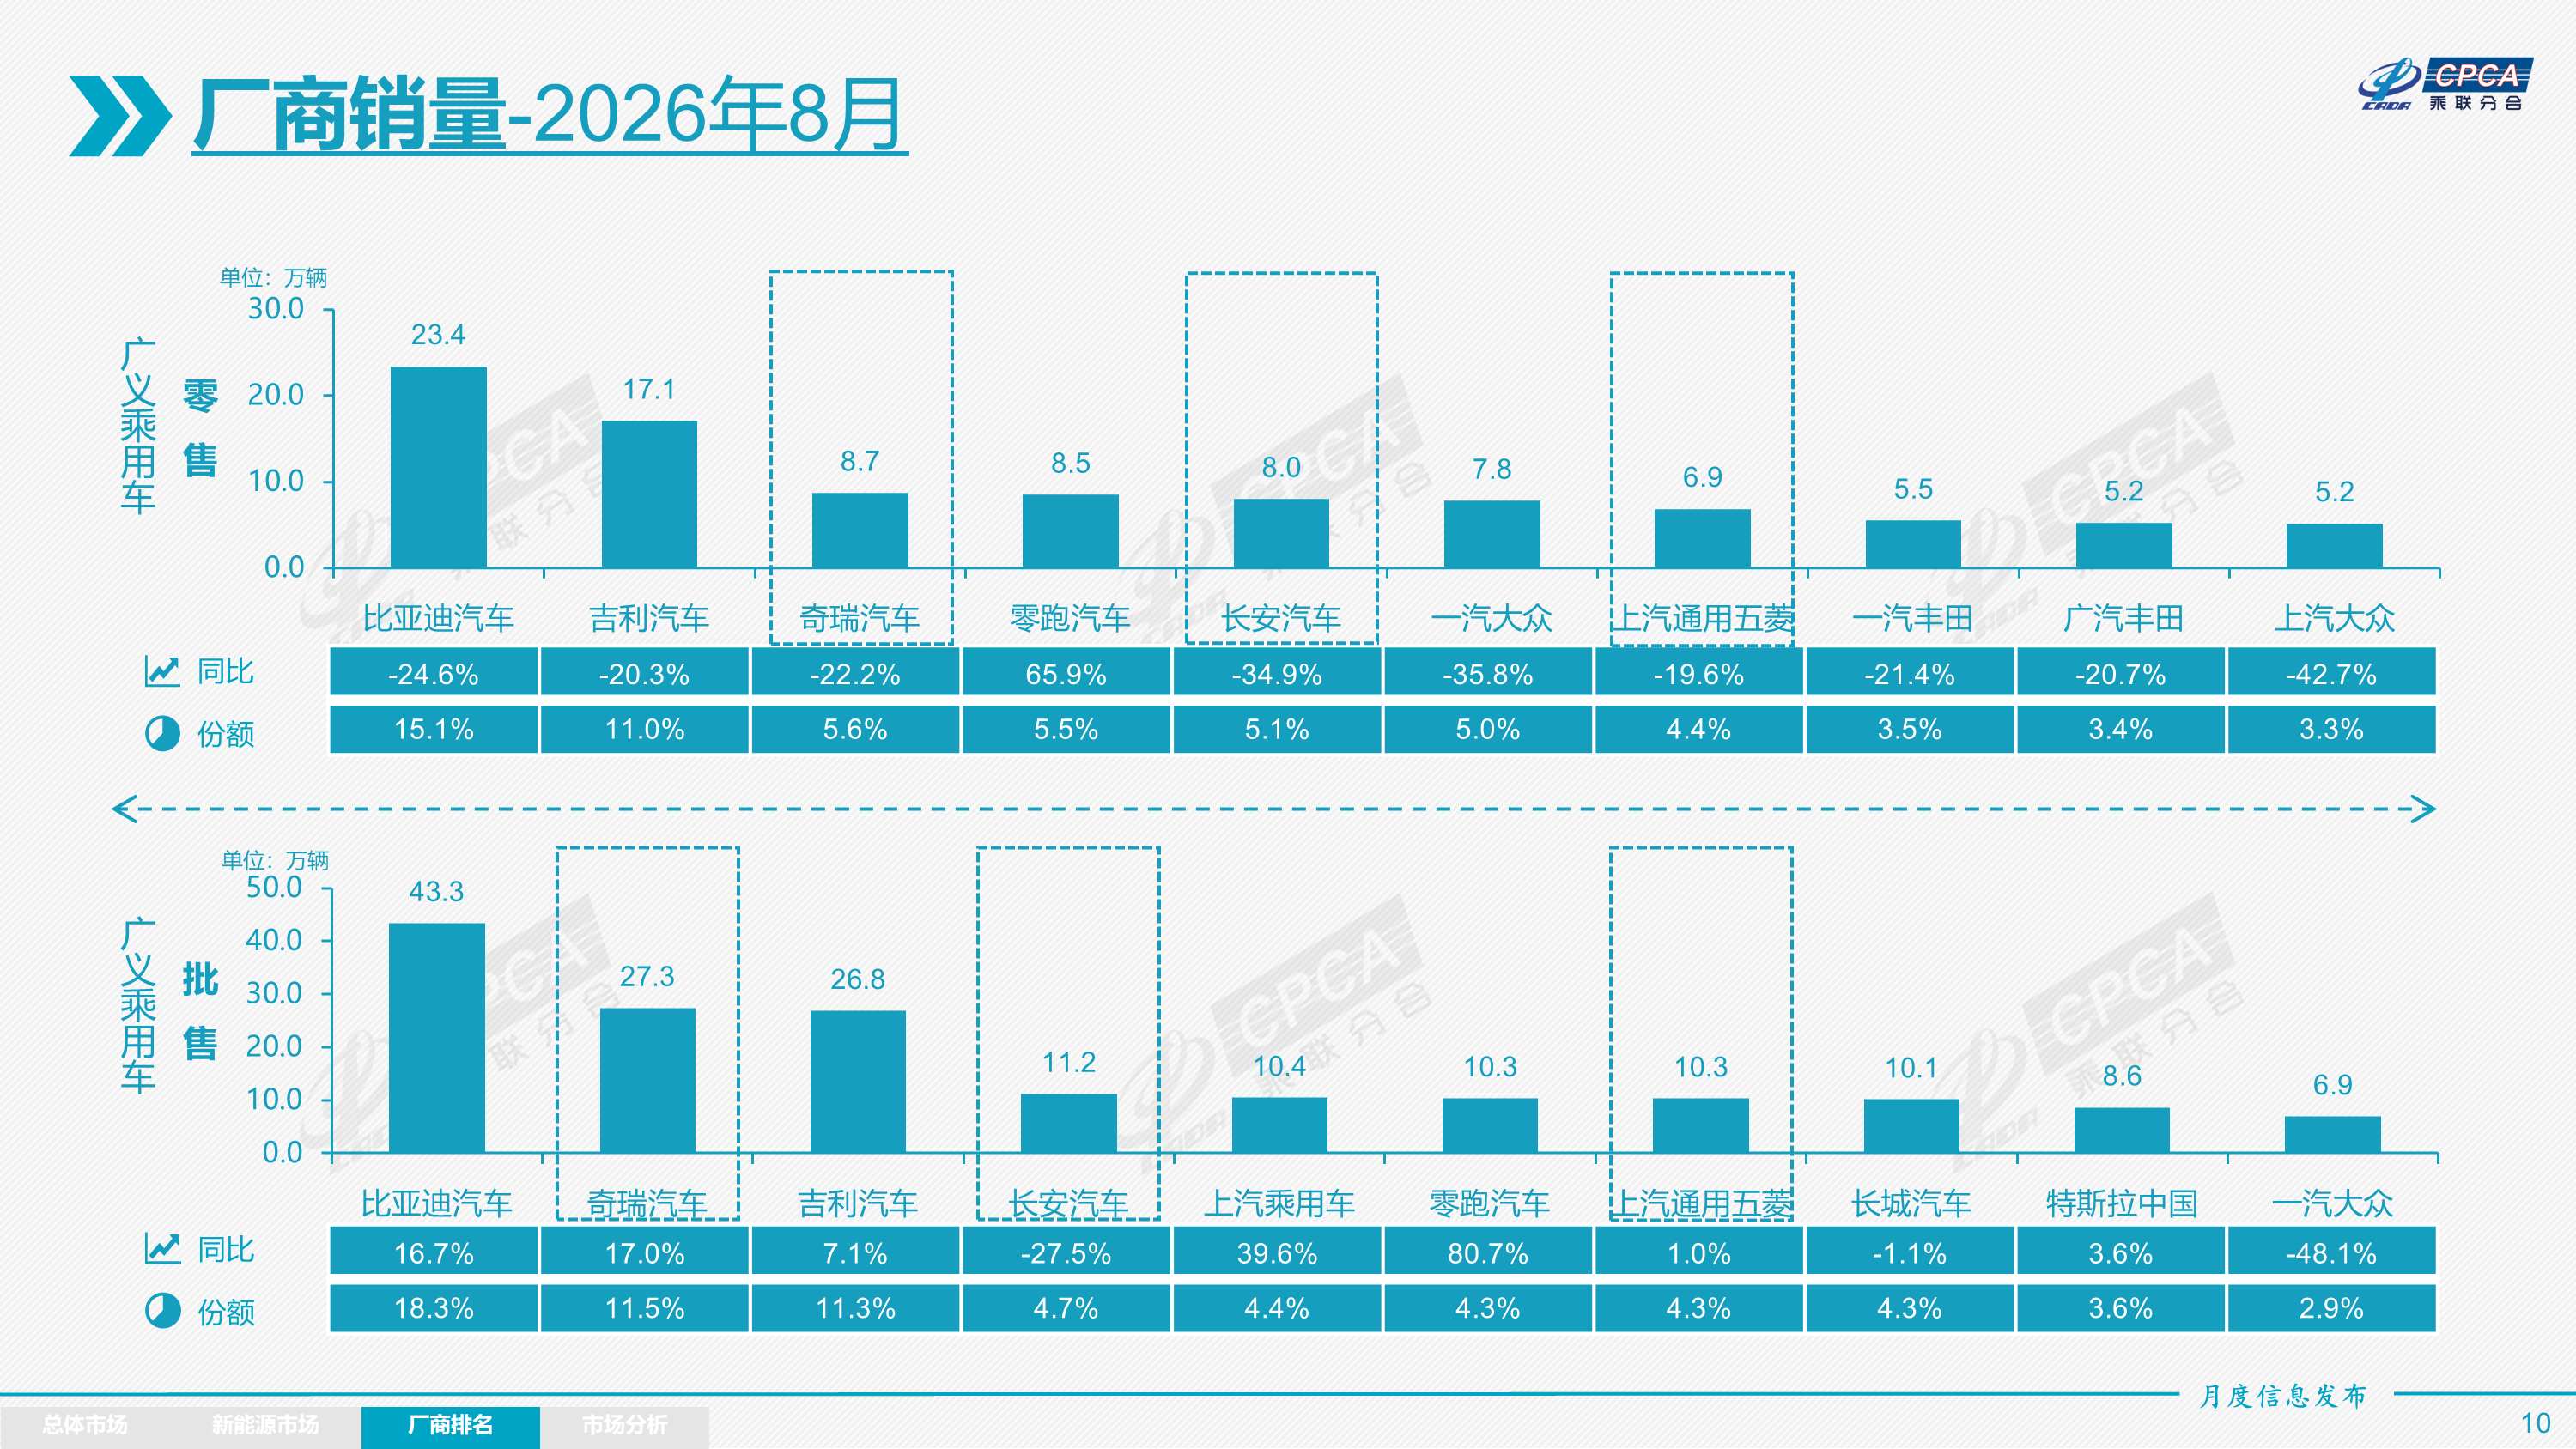
In August, the overall wholesale pattern of major passenger car manufacturers continued to change. Vehicle companies such as SAIC Passenger Car, Zero Sports Auto, Jihu Auto, Ideal Auto, GAC Aian, and BAIC Motor achieved high growth of more than 20% over the same period last year. Car market concentration increased further in August. Seven passenger car manufacturers with wholesale sales volume of over 100,000 vehicles (5 in the previous month and 6 in the same period last year) accounted for 59.1% of the overall market share (50% last month and 50% in the same period). Passenger car manufacturers with a wholesale volume of 5-10 million vehicles accounted for 15.0% (19% last month, 23% in the same period), and passenger car manufacturers with a wholesale volume of 10,000 to 50,000 vehicles accounted for 23.9% (27% last month, 25% in the same period).
Inventory: Due to the manufacturer's extremely cautious production schedule in August, the manufacturer's wholesale production was higher than the production of 50,000 units, while the manufacturer's monthly domestic wholesale was lower than the domestic retail price of 76,000 units. The characteristics of inventory removal are prominent this year. The overall inventory of the passenger car industry fell by 730,000 units in January-August (310,000 units in the same period in 2025, 760,000 units in the same period in 2024, and 200,000 units in the same period in 2023).
New energy: In August, production of new energy passenger vehicles reached 1,528,000 units, up 19.2% year on year and 5.0% month on month. The cumulative production of new energy passenger vehicles reached 9.758 million units in January-August, an increase of 9.8% over the previous year.
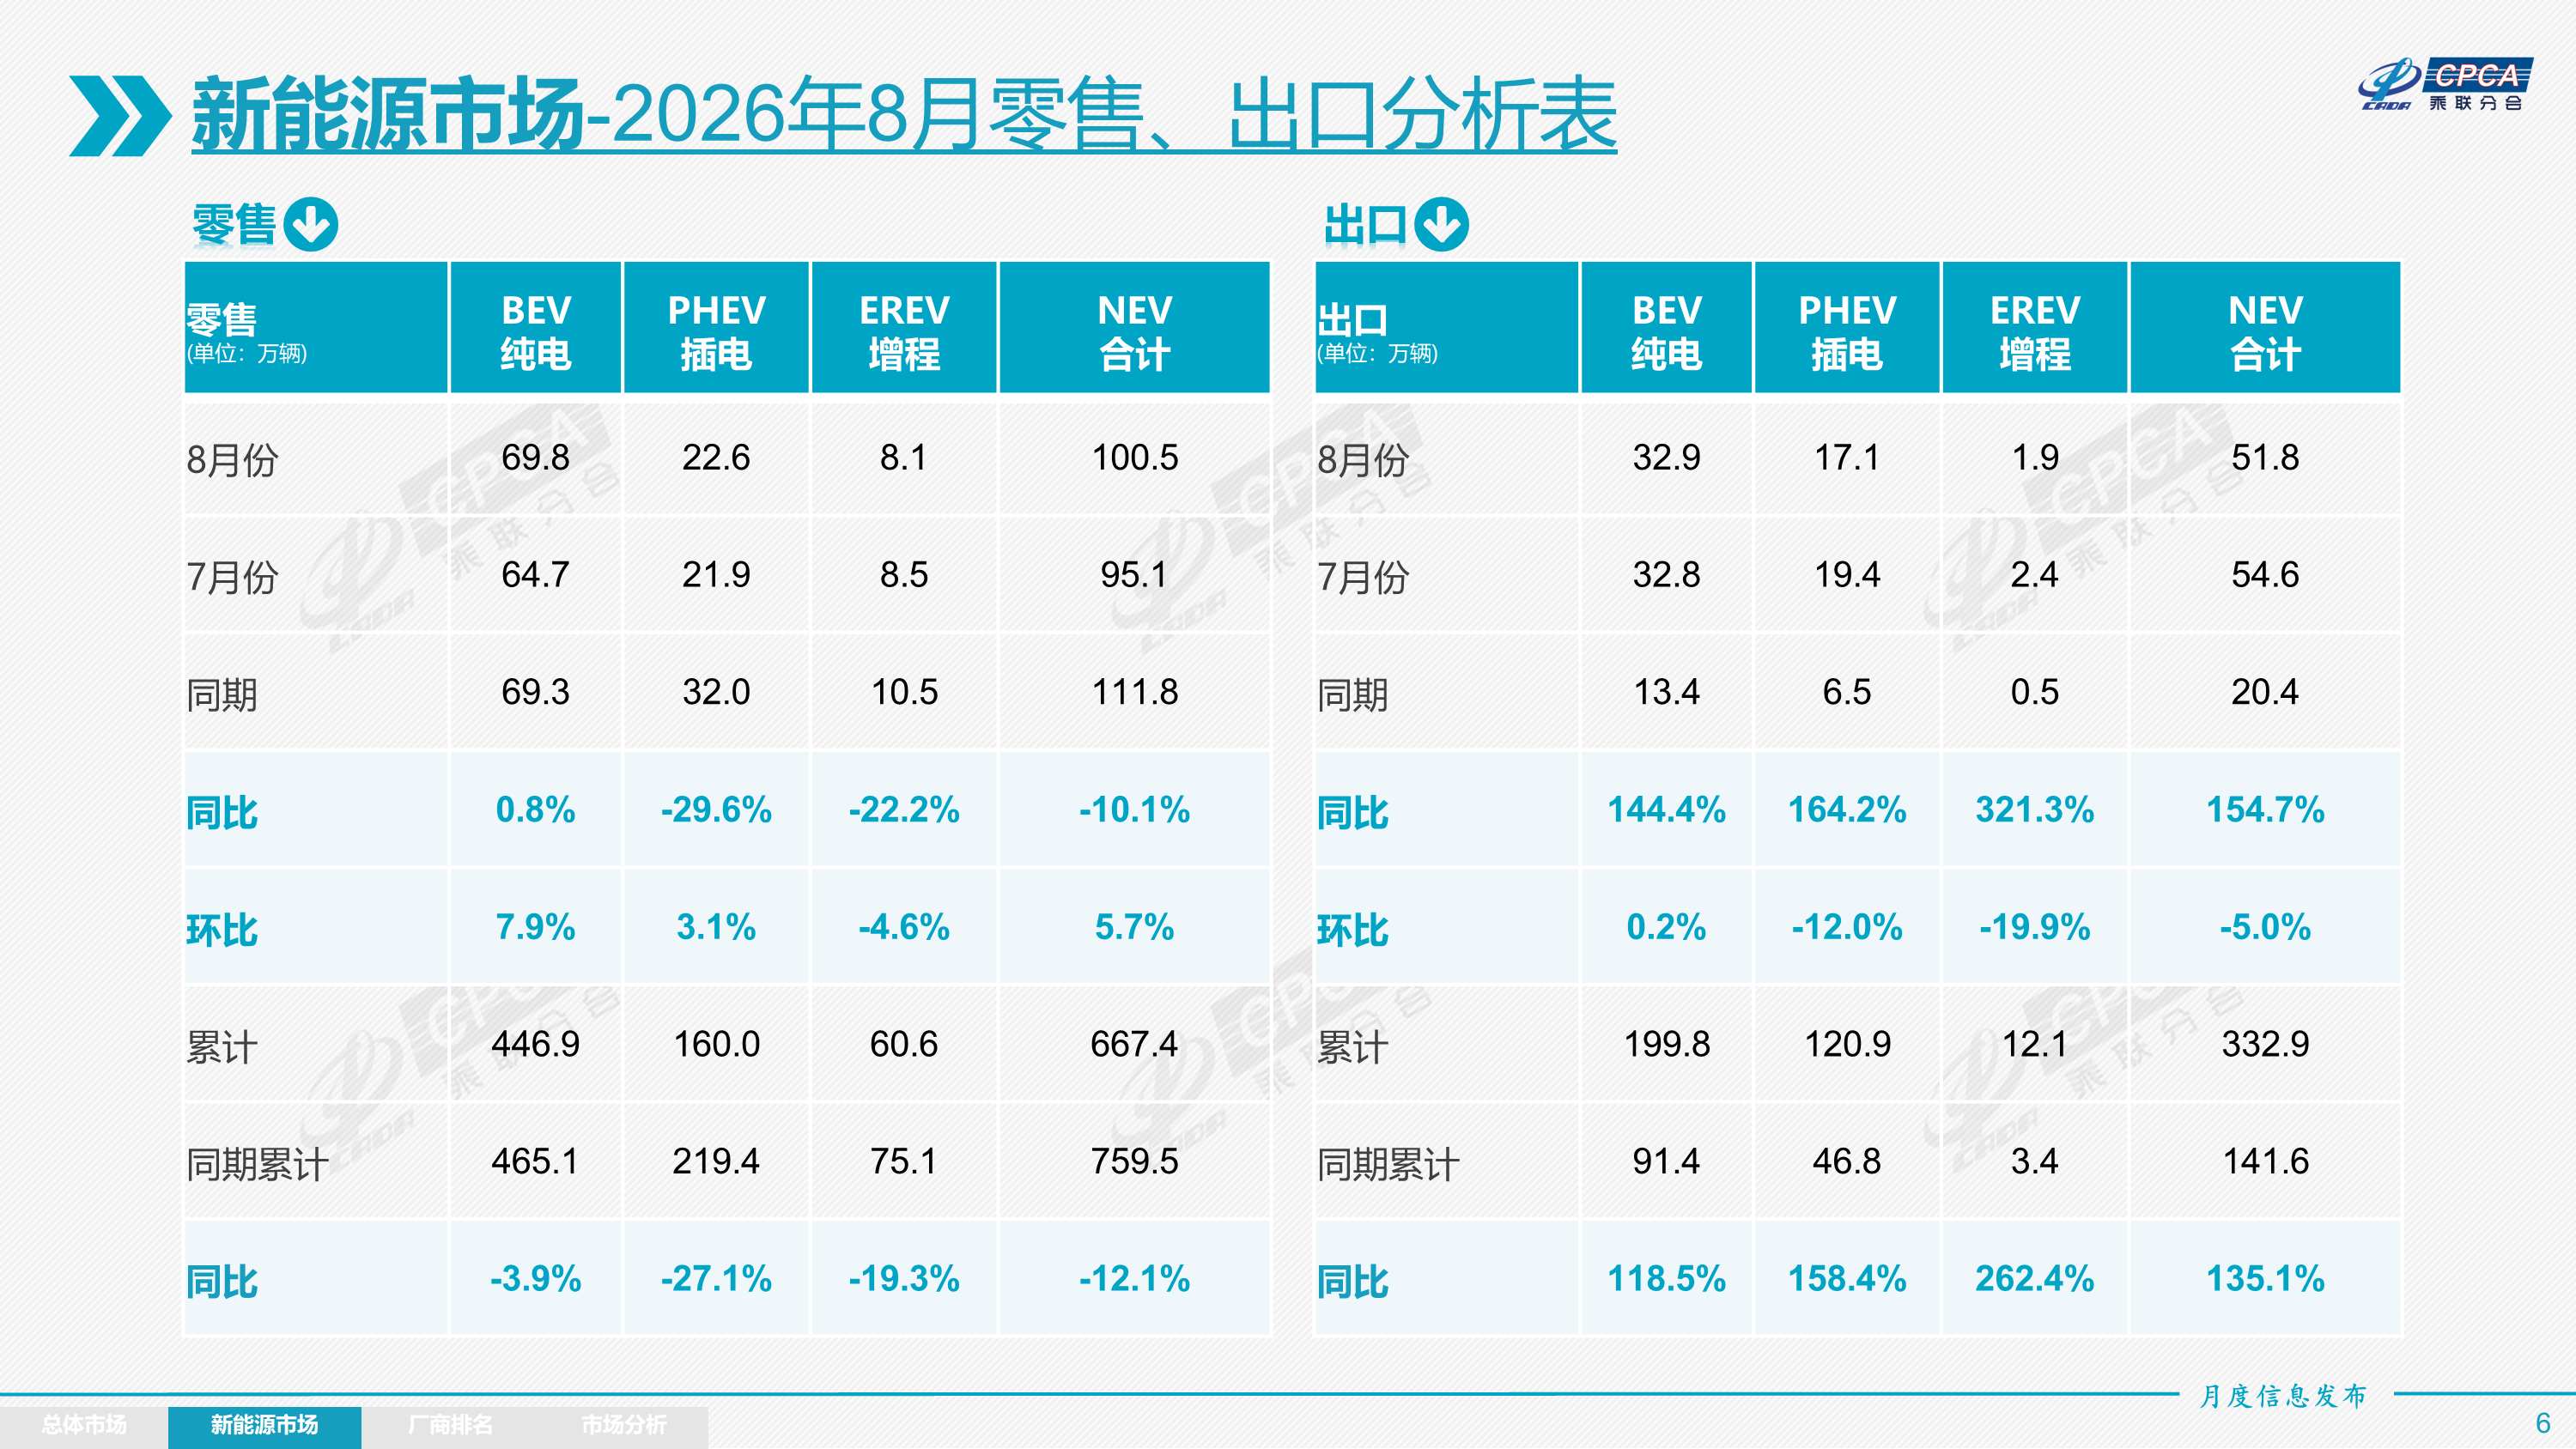
In August, wholesale sales of new energy passenger vehicles reached 1.51 million units, up 16.4% year on year, up 3.9% month on month; in January-August, wholesale sales of new energy passenger vehicles reached 9.778 million units, up 9.1% year on year. Wholesale sales of conventional fuel passenger cars reached 840,000 units in August, down 29% year on year and up 5% month on month. In August, the NEV passenger car market retailed 1.05 million vehicles, down 10.1% year on year and up 5.7% month on month; in January-August, the NEV passenger car market retailed 6.674 million vehicles, down 12.1% year on year. In August, 540,000 conventional fuel passenger cars were retailed, down 40% year on year and up 5.1% month on month. In August, NEV manufacturers exported 518,000 vehicles, up 154.7% year on year, down 5.0%; in January-August, NEV manufacturers exported 3.329 million vehicles, up 135.1% year on year. In August, conventional fuel passenger vehicle exports were 369,000 units, up 25% year on year and 3% month on month.
1) Wholesale: The wholesale penetration rate of NEV manufacturers was 64.2% in August, up 12 percentage points from August 2025. In August, the penetration rate of own-brand new energy vehicles was 74.3%; the penetration rate of new energy vehicles among luxury cars was 53.1%; and the penetration rate of mainstream joint venture brand NEVs rose to 15.7%.
In August, wholesale sales of pure electric vehicles were 1.032 million units, up 25.9% year on year, up 6.8% month on month; in August, plug-in sales were 386,000 units in the narrow sense, up 3.1% year on year, down 0.3% month on month; in August, extended range wholesale sales were 93,000 units, down 10.9% year on year, down 8.0% month on month. In the new energy wholesale structure in August, pure electricity accounted for 68.3% (YoY +5.3%, month-on-month +1.9%), narrow interpolation accounted for 25.6% (-3.4% YoY, -1.1% month-on-month), and extended range accounted for 6.1% (-1.9% YoY, -0.8% month-on-month).
In August, 303,000 B-class electric vehicles were sold, up 24% year on year and 1% month on month, accounting for 29% of pure electric vehicles, down 0.6 percentage points from the same period last year. There is a lot of pressure on the A00 class economy electric vehicle market in the pure electric market. In August, A00 class wholesale sales volume was 61,000 units, down 51% year on year, up 17% month on month, accounting for 6% of pure electric vehicles, a sharp drop of 9.3 percentage points from the same period last year; A0 class wholesale sales volume was 365,000 units, accounting for 35% of pure electric vehicles, up 12.2% year on year. ; A-class electric vehicles are 252,000, accounting for 24% of the pure electric share, down 3.3 percentage points from the previous year; judging from the long-term popularity trend, the growth of economical electric vehicles has the greatest potential, and only the popularity of entry-level electric vehicles can truly drive a sustainable increase in the car market.
In August, there were 21 passenger car wholesale sales of more than 20,000 units (18 last month), BYD UP (64,170 units), BYD Song (63,637 units), Geely Xingyuan (60,955 units), Model Y (55,697 units), BYD Seagull (36,106 units), Binyue (33,515 units), Tiggo 7 (32,930 units), Zero Run A10 (32,214 units), Formula Baoti 7 (30,572 models), and 3 Model 3 30,469 vehicles), BYD Dolphin (29,147 vehicles), Chery JAECOO J5 (28,800 units), Wuling Bingguo (25,602 units), MG 4 EV (23,454 units), BYD Seal 06 (23,002 units), Qiyuan Q05 (22,680 units), Jetway Traveller (21,460 vehicles), Deep Blue S05 (21,002 vehicles), Starship 7 (20,834), BYD PLUS (20,380 vehicles), Zero Run (20,380 vehicles), Zero Run (20,380 vehicles) 011 units) . Among them, new energy models occupy an absolute dominant position.
2) Retail sales: In August, the overall retail penetration rate of new energy vehicles in China was 65.2%, up 9.9 percentage points from the same period last year, and 0.1 percentage points from month to month. In domestic retail sales in August, the penetration rate of new energy vehicles among independent brands was 83.9%; the penetration rate of new energy vehicles among luxury cars was 38.9%; while the penetration rate of new energy vehicles in mainstream joint venture brands only rose to 13.4%. Looking at the monthly domestic retail share of new energy vehicles, in August, the retail share of own-brand NEVs was 63.7%, down 6.1 percentage points from the previous year; mainstream joint venture brands had a share of 4.3% of new energy vehicles, up 0.7 percentage points from the previous year; the share of new forces was 26.0%, and brands such as Zero Sports Auto and NIO Auto drove the share of new forces to increase 5.5 percentage points year on year.
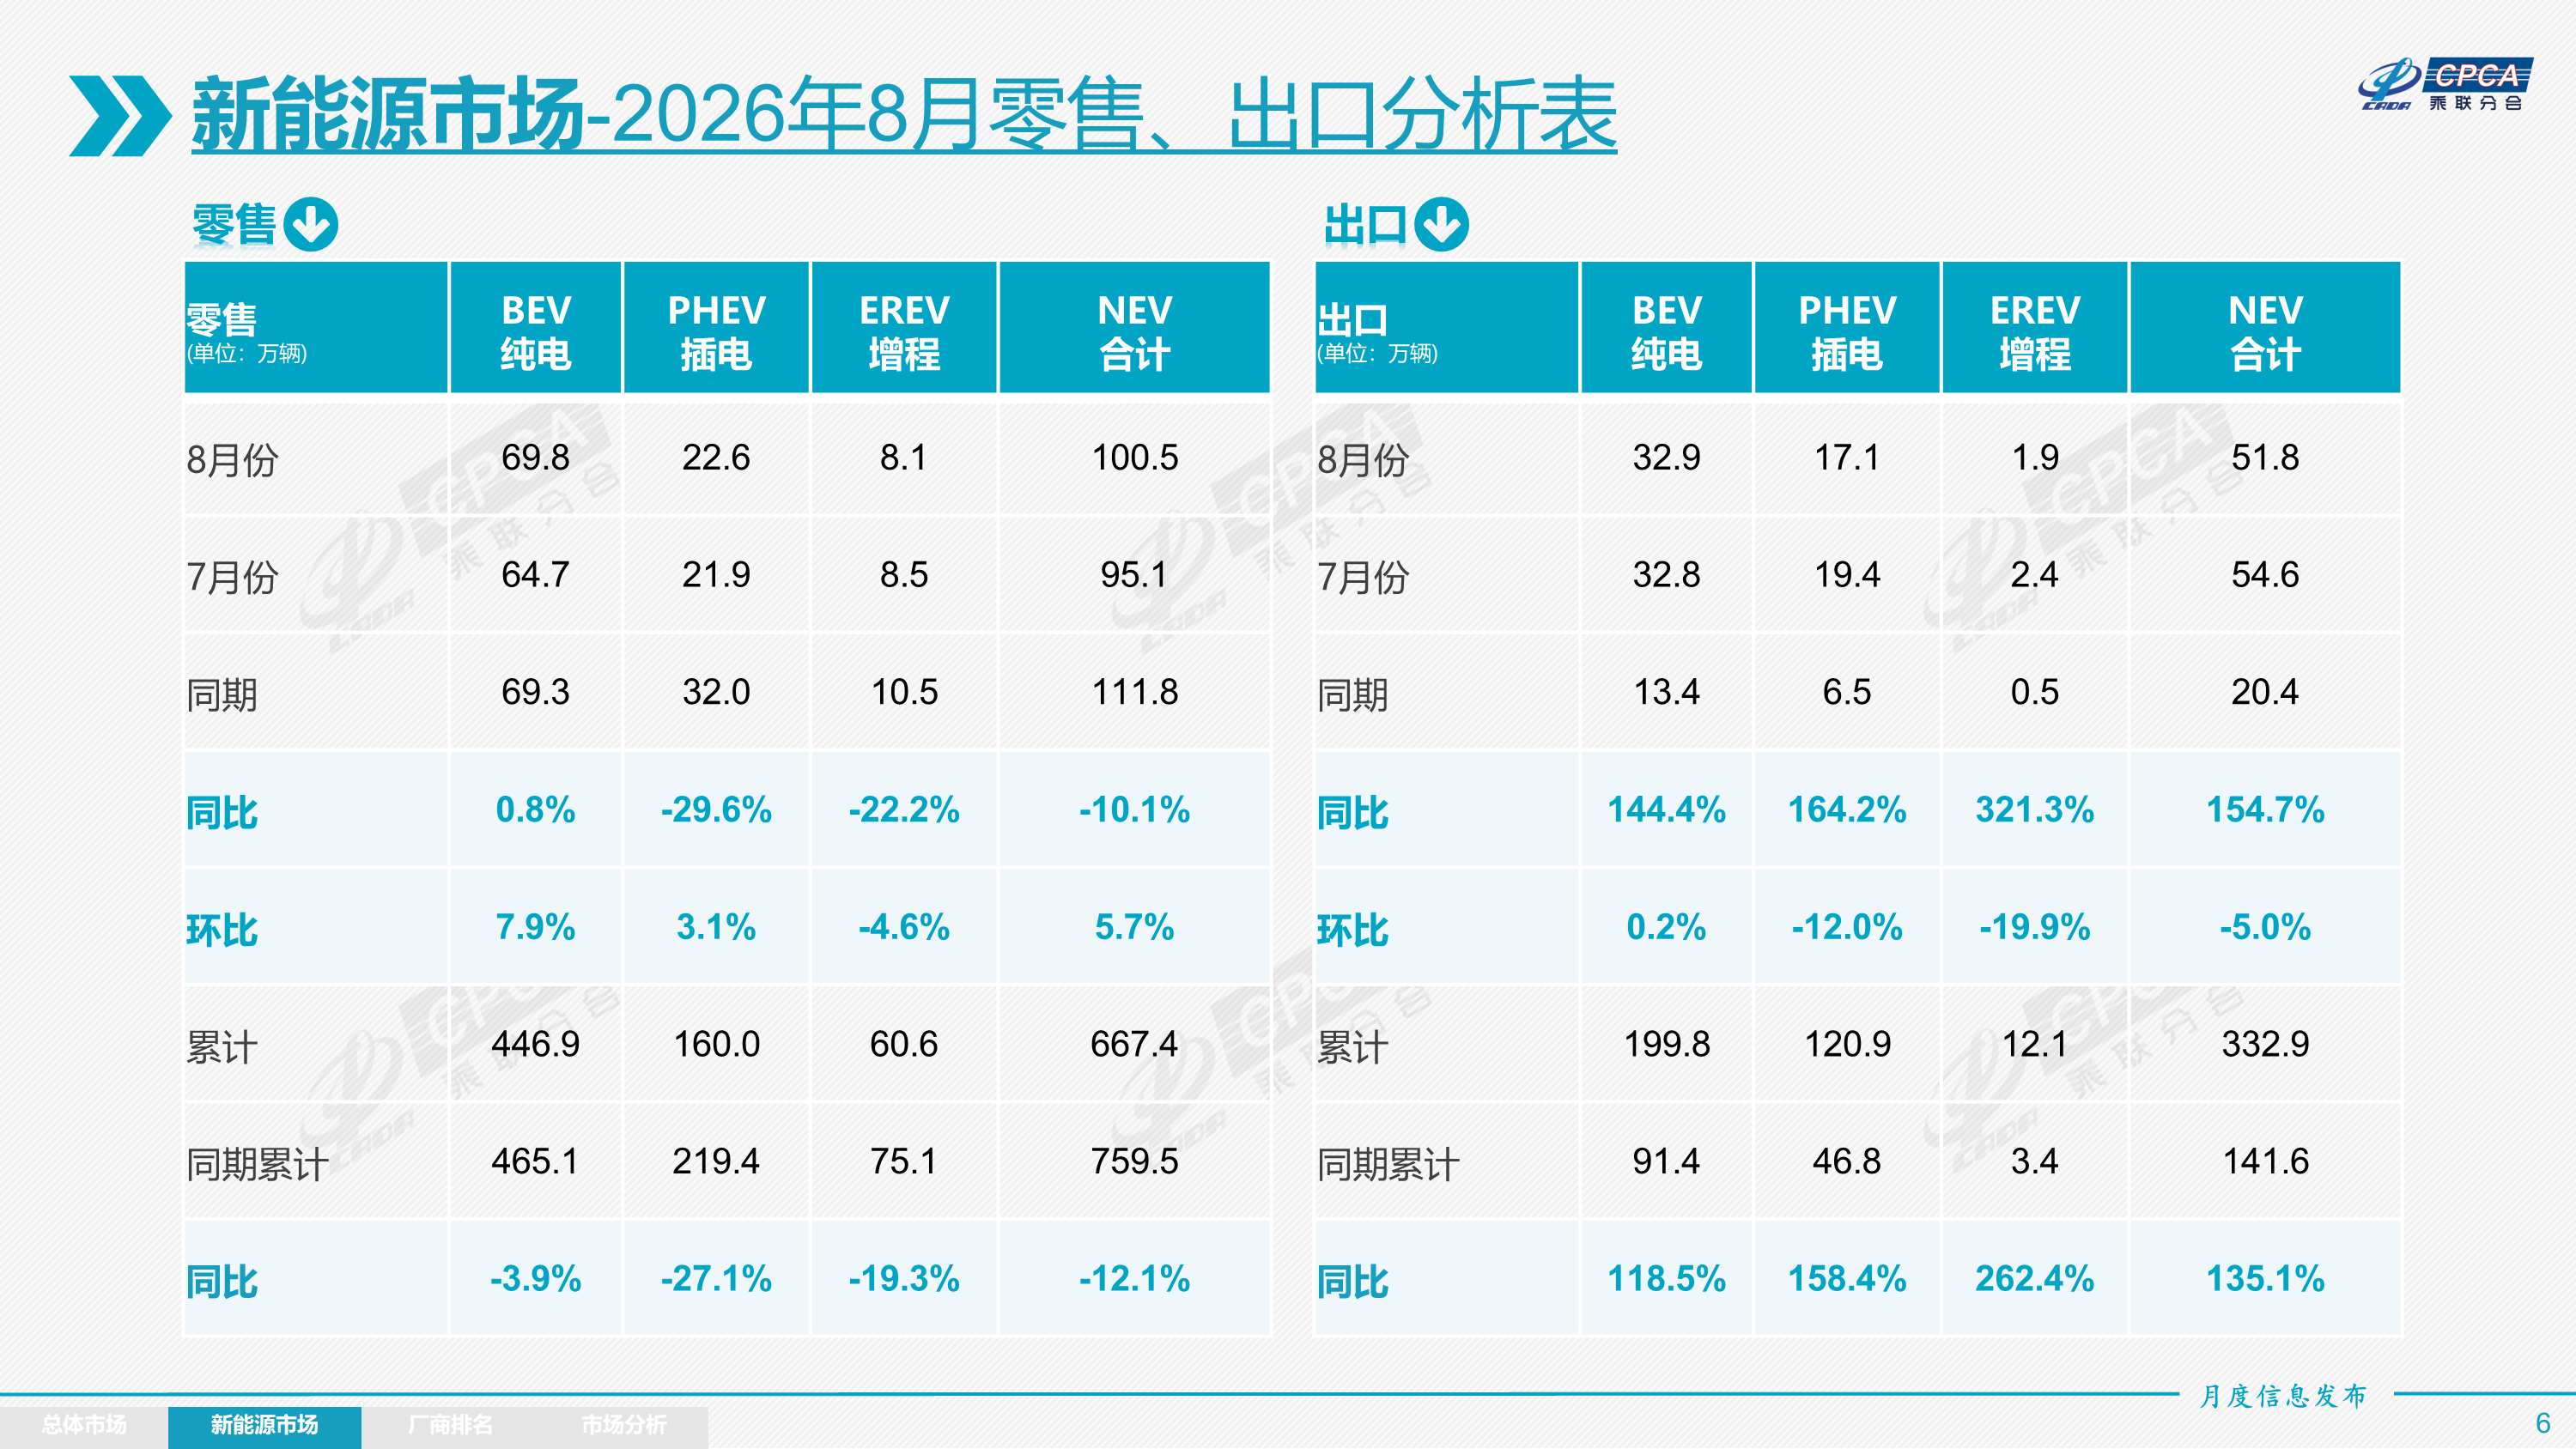
3) Exports: In August, 518,000 new energy passenger vehicles were exported, up 154.7% year on year and down 5.0% month on month. Passenger car exports account for 58.4%, an increase of 18 percentage points over the same period last year; of these, pure electric vehicles account for 63.4% of new energy exports (66.0% in the same period last year), and A00+A0 class pure electric vehicles, which are the core focus, account for 56.5% of pure electric exports (45.2% in the same period last year). As the scale advantage of new energy vehicles in China becomes apparent and market demand expands, new energy brand products made in China are increasingly going abroad, and their recognition overseas continues to increase. Among them, the narrow interpolation accounted for 32.9% of new energy exports (31.7% in the same period last year), and the growth range accounted for 3.7% of new energy exports (2.2% in the same period last year). Despite some recent interference from outside countries, the number of autonomous, narrowly mixed exporting developing countries is growing rapidly, and the prospects are promising. Excellent companies in terms of new energy exports in August were: BYD (184,446), Geely (69,910), Chery (68,431), Tesla China (36,119), Changan (28,323), SAIC Passenger Cars (24,991 units), Zero Sports (18,255 units), and SAIC-GM Wuling (17,376 vehicles).
Looking at overseas system construction, some independent brands account for a relatively high share of CKD exports, and their international performance is excellent. Among them, Great Wall Motor's CKD exports account for 48.5%, SAIC-GM-Wuling CKD exports account for 36.4%, Pilot Motor's CKD exports account for 16.6%, and SAIC Motor's CKD exports account for 15.9%.
4) Vehicle companies: The overall trend of new energy passenger car companies was strong in August. BYD's pure electric and plug-in hybrid dual drives consolidated its leading position in new energy brands; plug-in hybrid performance in the narrow sense represented by BYD, Geely, and Chery continued to be strong. In terms of product launch, with autonomous vehicle companies' implementation of the “multi-line approach” strategy on the new energy route, the market base continued to expand, and the number of manufacturers with monthly wholesale sales of new energy exceeding 10,000 vehicles reached 19 (2 fewer than the previous year and 1 less than the previous month), accounting for 93.6% of the total number of new energy passenger vehicles (93.7% last month and 93.5% in the same period last year). Among them, BYD (432,684), Geely (173,675), Chery (115,245), Zero Sports (103,129), Tesla China (86,166), Changan (75,788), SAIC-GM Wuling (70,941), SAIC Passenger Cars (57,728), Great Wall Motors (40,695), Xiaopeng (39,107), Ideal (37,679), and NIO (37,679) (35,836 units ), GAC Aian (33,694), Xiaomi (30,153), Cyrus (20,509), Dongfeng (18,649), Jihu (17,094), GAC Toyota (12,602), SAIC-GM (12,043).
The brands that have sold more than 20,000 new energy passenger vehicles in China are: BYD Auto (233,943), Geely (110,560), Sport (84,874), Changan (57,874), SAIC-GM-Wuling (53,087), Tesla China (50,047), Chery (46,391), Hongmeng Zhixing (42,101), Ideal Auto (37,679), NIO (35,655), Changlai (35,655) City Motors (33,531 Vehicles), Xiaopeng Motors (30,982 units), Xiaomi Motors (30,153 units), SAIC Passenger Cars (27,663 units), GAC Aeon (24,510 units).
5) New forces: In August, the retail share of the new forces was 26.0%, an increase of 5.5 percentage points over the previous year. Among the new power models, pure electric sales accounted for 78.2%, a significant increase from 68.2% in the same period; the share of sales in the 10-150,000 class of new power electric vehicles increased dramatically. Independent new energy brands from independent traditional car companies performed well as second-generation players, with a share of 15.1%, an increase of 2.3 percentage points over the previous year. Self-innovating energy brands from large independent groups such as Jikrypton, Yipai Technology, Deep Blue Auto, Extreme Fox, and Rantu performed well.
6) General hybrid: In August, 107,000 ordinary hybrid passenger cars were sold, up 54% year on year and 10% month on month. Among them are FAW-Toyota (36,403), GAC Toyota (29,802), SAIC (16,304), Geely (10,890), Dongfeng Honda (4,126), Great Wall (3,792), GAC (2,422), Changan Ford (1,917), and Guangqi (1,046). Autonomous hybrids such as SAIC passenger cars and Geely have risen to prominence in overseas markets. 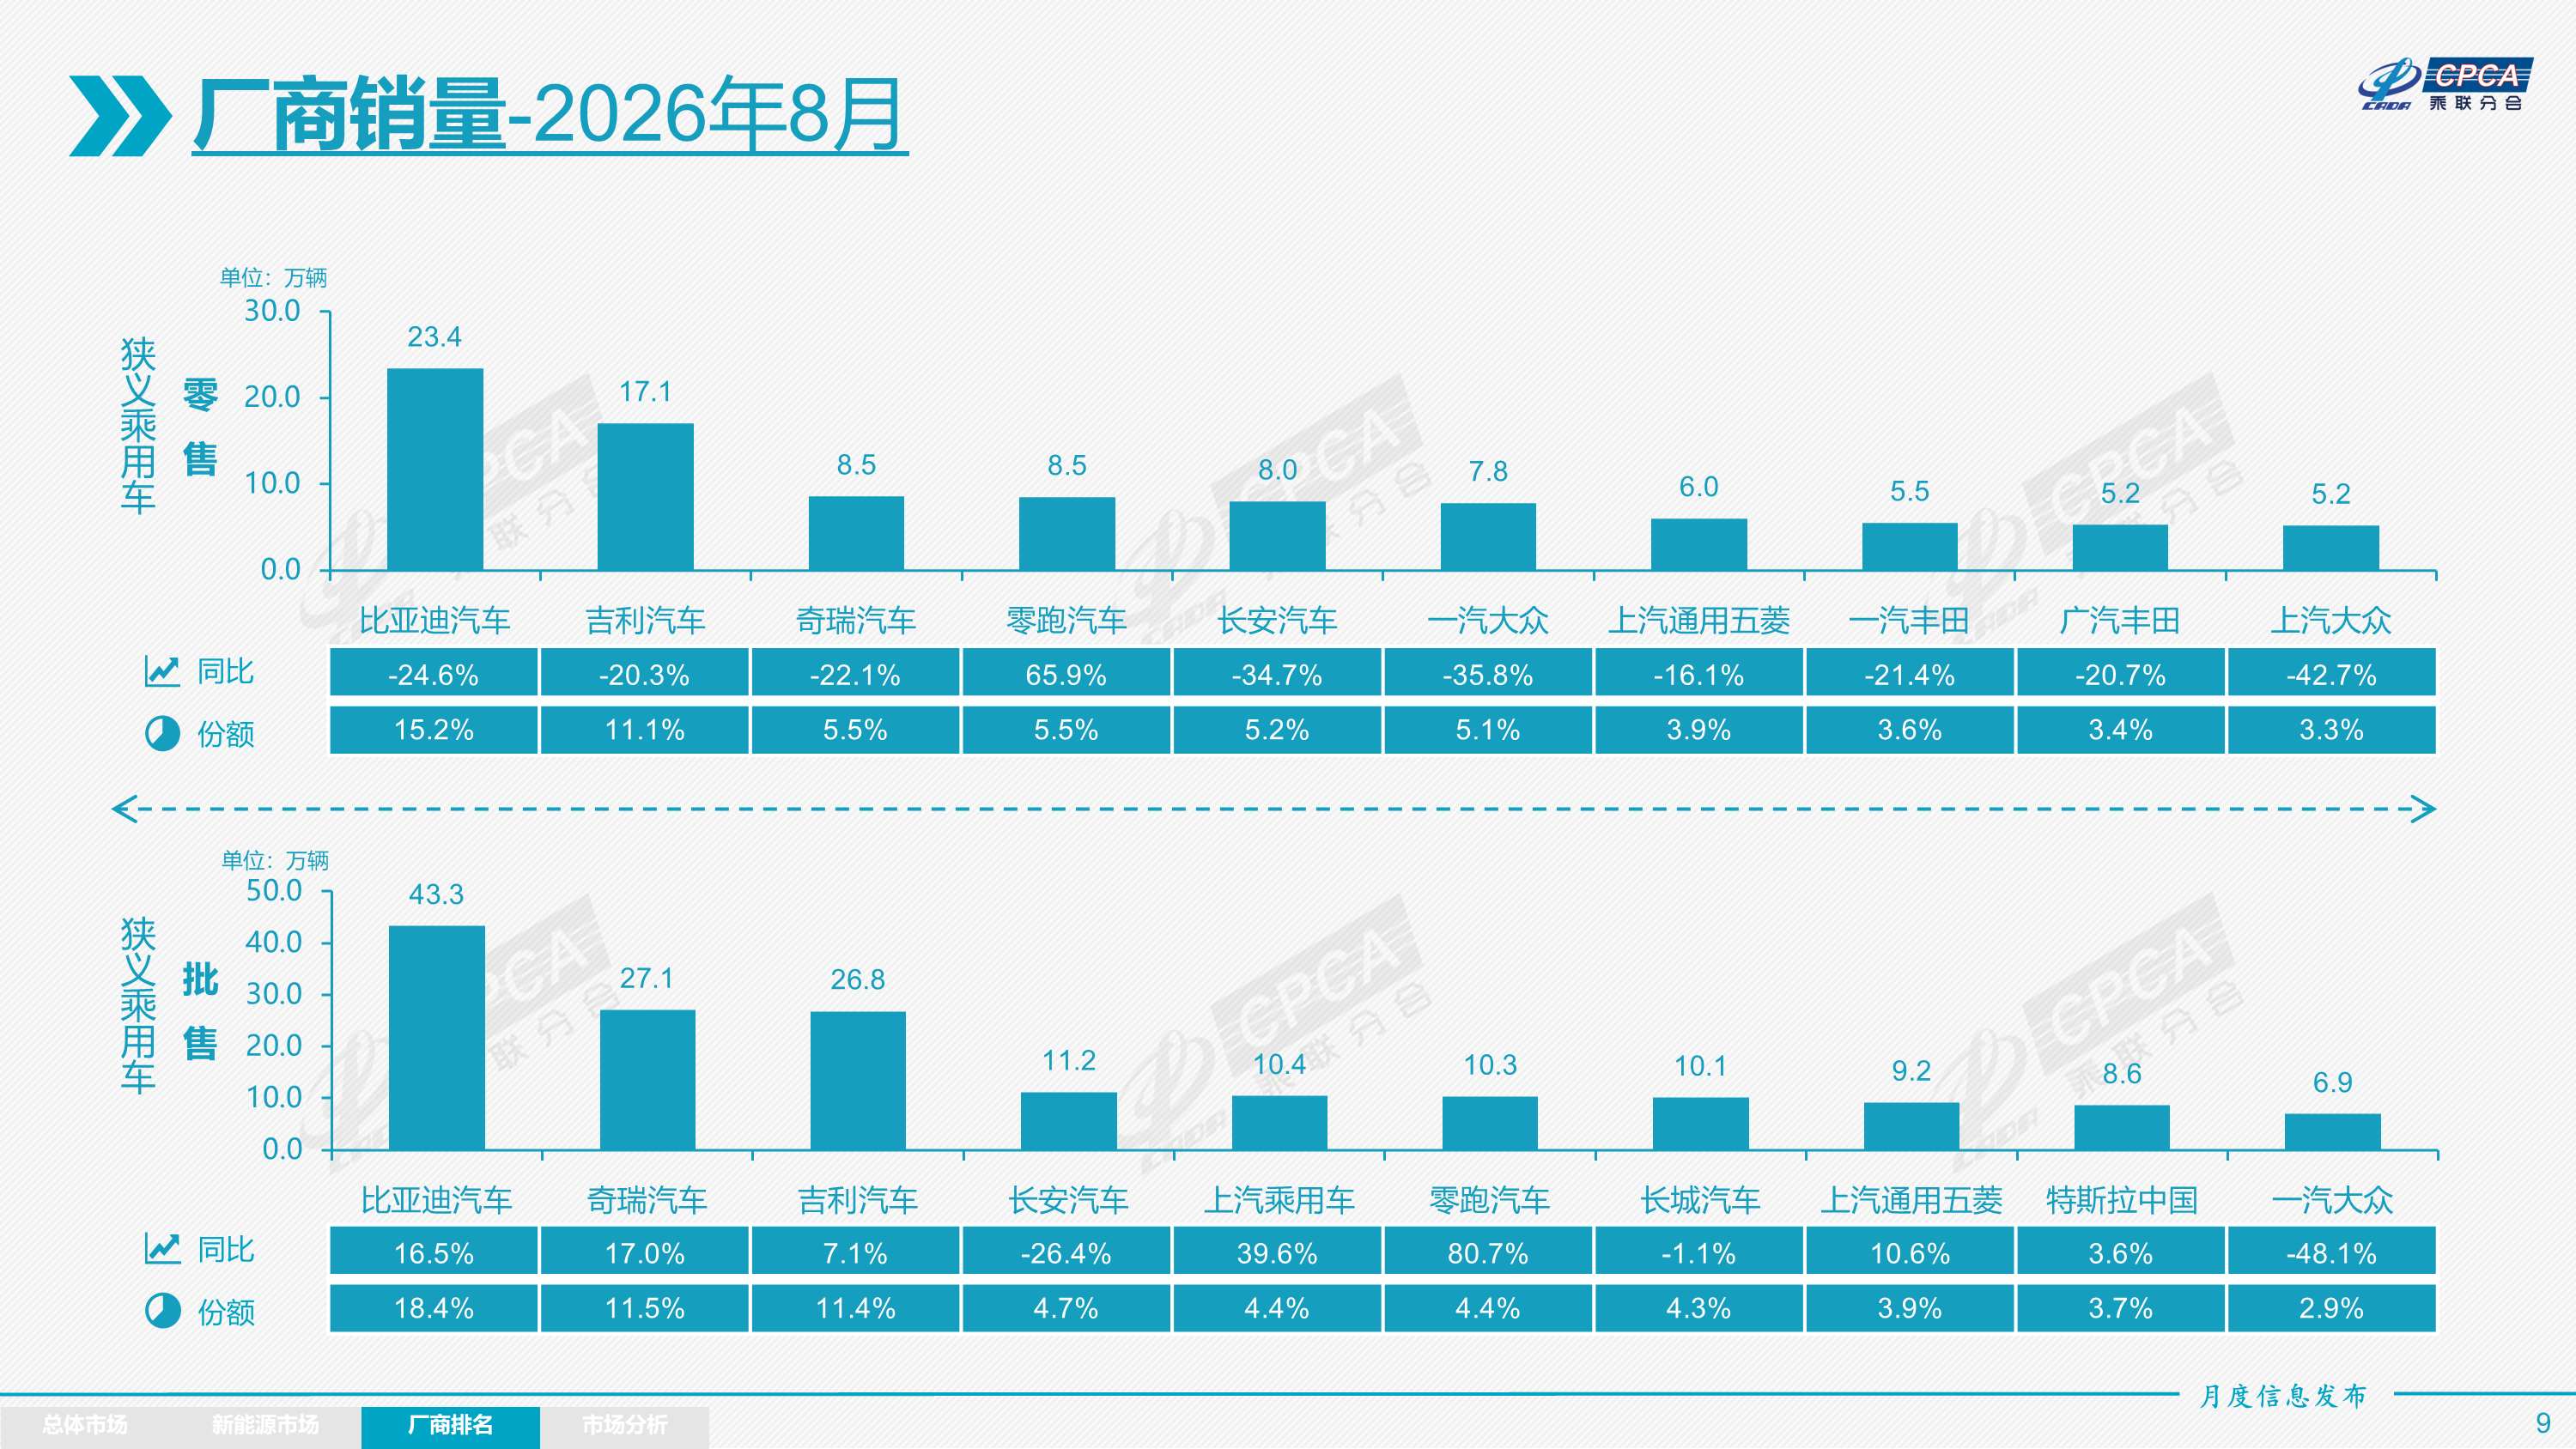
National passenger car market outlook for September 2026
Affected by the early Mid-Autumn Festival on September 25 this year, there were a total of 22 working days in September, 1 less than the same period last year. In September, the market entered the traditional “gold nine silver ten” peak consumption season, and terminal passenger traffic is expected to continue to pick up. At the macro level, the manufacturing PMI rebounded month-on-month and the CPI was stable in August. The economy showed operating characteristics of “marginal recovery in demand and stabilization at a low level of total volume”, providing bottom support for the recovery of the car market. However, September faced a high base in the same period last year — the rush to buy in September 2025 before subsidies were stopped in some regions drove retail sales to a record peak in that month, and the effects of the high base will further inhibit the recovery in September this year. Since the end of July, the cumulative increase in gasoline during the year has exceeded 830 yuan/ton, and the appeal of new electric vehicles is becoming stronger, and the willingness to consume fuel vehicles continues to be suppressed. Prices of upstream raw materials have declined somewhat. Coupled with the gradual deepening of the “anti-domestic roll” consensus in the industry, upstream profits have skyrocketed; however, price pressure is transmitted from upstream to the vehicle side, and the operating pressure on automakers continues to increase.
At the policy level, the trade-in subsidy policy continues to be strengthened this year. The amount of subsidies is expected to show a trend of low and high levels. Many local governments will further increase it in September, which will effectively drive the car market to heat up in September. As the trend of large-scale electric vehicles becomes more prominent, families choose to drive large electric vehicles for self-driving, and the National Day trip in October is expected to further boost sales of large electric vehicles.
With the release of domestic standards for assisted driving and L3 smart driving products, the smart driving section of the Road Traffic Law has begun to be revised. Overseas driverless rental has reached a new level, and assisted intelligent driving is moving from “trial” to “standard”. Low-cost intelligent technology is the key to competition. Consumer expectations for smart driving technology highlights will continue to drive the attention and purchase intention of high-end smart driving models, and is expected to become a new driving force for the structural growth of the NEV market.
As anti-domestic efforts continue to advance, the car market is expected to continue its month-on-month recovery trend in September. After the high base effect subsides, the year-on-year decline will narrow markedly. Judging from the characteristics of passenger car consumption, the current market shows three core characteristics: first, high fuel prices continue to suppress demand for fuel vehicles, “oil and electricity substitution” is accelerating, the penetration rate of new energy is operating at a high level of 65% or more, and the weight of vehicle costs in consumer car purchase decisions continues to rise; second, demand for high-end models of Class B and above is strong, but demand for A-class and A00-class economy electric vehicles continues to shrink due to complex factors; third, new consumer demand for consumer AI driven by smart driving is being formed. Smart driving features get a lot of attention Improvement, technical experience is becoming the third biggest deciding factor for car purchases after continuing navigation and energy supplementation; fourth, the trend of pure electrification in the A-class car market is obvious, and the improvement in fast charging technology for bicycles at high fuel prices will effectively drive sales of A-class electric vehicles.
3. Auto industry profit margin 3.6% from January to July 2026
From January to July 2026, in the face of multiple challenges such as the complex evolution of the international environment and domestic transformation pressure, the national economy started well, improved quality and efficiency, rapid profit growth in the equipment manufacturing and high-tech manufacturing industry, and double-digit profit growth in the raw materials manufacturing industry all laid a solid foundation for the smooth operation of the economy throughout the year. In July 2026, automobile production was 2.53 million units, the same as the previous year; production of new energy vehicles was 1.55 million units, up 30% year on year, with a penetration rate of 61%; fuel vehicle production was 980,000 units, down 27% year on year. In July 2026, the automobile industry's revenue was 888.7 billion yuan, up 8.3% year on year; the cost was 795.7 billion yuan, up 10%; profit was 20.9 billion yuan, down 28% year on year; and the automobile industry's profit margin was 2.4%. From January to July 2026, automobile production was 17.61 million units, down 3% year on year; new energy vehicle production was 8.95 million units, up 10% year on year, penetration rate 51%; fuel vehicle production was 8.67 million units, down 14% year on year. From January to July 2026, the automobile industry's revenue was 6,078 billion yuan, up 2.7% year on year; cost was 5,405.8 billion yuan, up 3.8%; profit was 26.2 billion yuan, down 20% year on year; the automobile industry's profit margin was 3.6%, compared to the average profit margin of downstream industrial enterprises of 6.5%, the automobile industry is still low.
In 2026, various regions vigorously promoted the implementation of the “two new” policies, which gradually effectively unleashed the vitality of domestic demand, but the improvement in the efficiency of the automobile industry clearly lags behind other consumer goods. Since this year, the automobile industry has been squeezed upstream, and procurement costs have remained high. Combined with the sharp rise in oil prices and profits from non-ferrous metals and semiconductors, the serious wait-and-see mentality of end users buying cars, and internal price pressure has continued to increase, and high-quality development has been greatly impacted by the upstream and downstream industries.
4. From January to July 2026, China exported 6.41 million vehicles
From January to July 2026, China achieved exports of 6.41 million vehicles, a year-on-year growth rate of 54%. In July, China achieved exports of 1.09 million vehicles, an increase of 57% year-on-year and an increase of 2% month-on-month. The year-on-year trend is generally strong, and the month-on-month trend is positive. The main drivers of export growth this year are still high oil prices and the increasing competitiveness of Chinese products, as well as continued growth in market demand in the global South.
The top 10 countries of China's total automobile exports in July 2026: Russia 94,700, the United Kingdom 65,245, Mexico 55,727, Belgium 52,078, Australia 51,263, the Philippines 39,936, Thailand 28,598, Saudi Arabia 25,731, Italy 25,386, and Spain 25,094, with the top five incremental increases over the same period: Russia 45,486, UK 33,454, Australia 26,829, Belgium 19,653 and 14,233 Spanish vehicles.
The top 10 countries with cumulative total vehicle exports from January to July 2026: Russia 542,857, Brazil 427,673, UK 320,505, Australia 289,086, Belgium 271,808, Mexico 265,882, Philippines 188,663, Italy 180,256, UAE 168,569, and Algeria 165,859. Among them, the top five were: Russia 312,897, Brazil 252,324, and the United Kingdom 152,302, Australia 121,197, and Algeria 107,481.
In July 2026, China exported 540,000 new energy vehicles, up 85% year on year, and achieved good results from month to month. From January to July, it exported 2.96 million vehicles, an increase of 72%, which is a good performance. In July 2026, pure electric vehicles accounted for 32% of China's automobile exports (+3% YoY), plug-in hybrid accounts for 18% (YoY +5%), ordinary hybrid accounts for 7% (YoY 0%), and pure fuel vehicles accounted for 35% (YoY -8%).
China's top 10 NEV exports in July 2026: Britain 51,411, Belgium 49,400, Australia 40,450, Philippines 36,843, Thailand 27,976, South Korea 17,788, Spain 15,895, Indonesia 15,800, Italy 14,835, and Mexico 12,387, with the top five incremental increases over the same period: the UK 29,146, Australia 24,099, Belgium 19,248, and Thailand 14,827 and the Philippines 13,518.
The top 10 countries with total NEV exports from January to July 2026: Brazil 306,534, Belgium 25,8617, the United Kingdom 232,671, Australia 207,576, the Philippines 162,905, Thailand 154,622, Germany 95,576, Italy 94,338, South Korea 93,218, and Spain 88,618. Among them, the top five were: Brazil 184,616, Australia 122,843, UK 118,362, 83,201 from Belgium and 81,124 from Thailand.
The export performance of China's new energy commercial vehicles from January to July 2026 was better than expected. Mainly, plug-and-hybrid replacement of pure electric vehicles became a new growth point for export growth. In particular, the export performance of pure electric trucks was strong, which became the highlight of commercial vehicle NEV exports. The recovered capacity contributed to a sharp increase in exports in July. China's NEV exports are mainly to Western Europe, Central and South America, while the Middle East market is still blocked.
5. From January to July 2026, China accounts for 31% of the world's automobile share
According to World Automobile Organization statistics, global automobile production continues to grow, reaching 96.38 million vehicles in 2025, an increase of 4% over 92.72 million vehicles in 2024. China accounts for 35.4% of the world's production share. According to our statistics, global car sales in 2025 were 96.89 million units, an increase of 6% over the previous year. World car sales reached 8.24 million units in July 2026, an increase of 5% over the previous year. From January to July 2026, world car sales reached 56.11 million units, an increase of 3% over the previous year.
In view of the negative sales growth in the US and Chinese car markets at the beginning of the year, sales growth in the world car market from January to July 2026 was not strong. China reached 35.4% of the world's automobile share in 2025; however, in early 2026, China's share fell back to 31.4%. Automobile sales in China declined significantly in early 2026. As a result of this year's subsidy policy, China's commercial vehicles strengthened, showing the characteristics of weak passenger cars, strong commercial vehicles, and a sharp increase in exports. We look forward to the introduction of policies to promote the consumption of low-end passenger cars. China's auto market is expected to gradually strengthen in the second half of the year as the effects of policy stimulus gradually resume.
From January to July 2026, global automobile sales increased by 3%, with Chinese car sales falling 4%, US sales falling 3%, Indian automobile market sales increasing 19%, Thai automobile market increasing 14%, Russian sales increasing 8%, and Vietnam increasing 29%. Emerging markets drive better market performance.
From east to west, with the exception of Toyota, Hyundai, Kia, Suzuki, and Tata, the share of other international brands declined sharply in 2026. Compared with 2019, the increase in the share of Chinese independent brands has greatly increased the share of Chinese cars in the world. Geely, BYD, Chery, SAIC, Changan, etc. have strong independent performance. The trend of electrification development in the world has also led to the gradual weakening of some international car companies. In addition to favorable factors in the Indian market such as Suzuki, the share of other international brands has declined significantly across the board.
6. From January to July 2026, China accounts for 62% of the world's new energy vehicles
From January to July 2026, world automobile sales reached 56.11 million units and 13.52 million new energy vehicles. From January to July 2026, the share of new energy vehicles reached 25.1%, with pure electric vehicles accounting for 16.8%, plug-in hybrids 7.3%, and ordinary hybrids reaching 8.1%, with excellent performance.
Due to the sharp recovery in the European energy trend, overseas countries sold 780,000 new energy vehicles in July, an increase of 29%; overseas NEVs sold 5.11 million units in January-July, a growth rate of 30%, which is close to the average of the previous two years. Among them, sales of 104,000 new energy vehicles in the US in July 2026 fell 20% year on year, and sales of new energy vehicles in the US were 710,000 in January-July, a decrease of 29%. European new energy passenger vehicles sold 3.86 million units in 2025, an increase of 960,000 units over the previous year, an increase of 33%. According to preliminary statistics, European new energy passenger vehicles sold 410,000 units in July, an increase of 38%, and cumulative sales of 2.79 million units from January to July 2026, an increase of 34%.
The overall penetration rate of new energy vehicles in the world is showing a rapid upward trend. It has reached 13.1% in 2022, 15.9% in 2023, 19.5% in 2024, 23.6% in 2025, and 24.1% of the world's NEV penetration rate in 2026. Among them, Germany reached 32.6%, Norway reached 81%, the UK reached 35%, while the US was only 7% and Japan was only 4%. From this, it can be seen that the world's new energy development is extremely uneven.
In 2025, the world share of new energy passenger vehicles in China was 68.3%; from January to July 2026, the world share of new energy passenger vehicles reached 62%, and reached a good level of 65.3% in July 2026. In 2026, China's share of the world's pure electric vehicle market was 58%. At the beginning of the year, China's pure electric vehicle market performance was temporarily poor, but in July it had already rebounded to 62%. In 2025, China's share of plug-in hybrids in the world reached a high level of 76.4%; in 2026, China's share of plug-in hybrids in the world reached a high level of 71%, reaching 74% in July. China showed excellent performance in the world plug-in hybrid market.
In 2025, the overseas sales share of autonomous new energy passenger vehicles was 15.8%, increasing rapidly. In 2026, the overseas market sales share of autonomous new energy passenger vehicles increased dramatically, reaching 28% in July, a significant increase.