
Longfor Group Holdings (SEHK:960) Gets A Fresh Look On August Sales And Half Year Results
Longfor Group Holdings (SEHK:960) is back in focus after reporting unaudited August contracted sales of RMB 2.20b and year to date contracted sales of RMB 20.84b, alongside fresh half year earnings data.
Investors have reacted quickly to the fresh August sales and recent half year earnings update, with Longfor Group Holdings’ share price rising 3.49% over the past day and 2.55% across the week. However, the 90 day share price return is down 24.09% and the 1 year total shareholder return has fallen 43.93%, suggesting short term momentum is improving against a much weaker longer term record.
Scan how Longfor Group Holdings compares with other beaten down property related plays by reviewing our curated list of list of solid balance sheet and fundamentals (194 results).
Longfor Group Holdings has just posted a small bounce after a steep multi year slide, which puts you at a simple fork in the road: lean into the rebound now, or wait and see what the valuation really says next.
Preferred Price-to-Sales Multiple of 0.5x: Is It Justified?
Valuation is where Longfor Group Holdings starts to look different to many Hong Kong property developers. Based on the latest data, the stock trades on a P/S ratio of 0.5x, which screens as good value both against peers and against an estimated fair P/S ratio for the business.
The P/S figure compares Longfor Group Holdings’ HK$6.23 share price with its revenue base, rather than its current earnings, which are in loss. That makes this metric particularly useful where net income is negative but the top line is still meaningful. For investors watching a sector under pressure, a lower P/S can indicate the market is pricing in weak future revenue or margins, while a higher one often reflects optimism that sales quality or profitability will improve.
On Simply Wall St’s checks, Longfor Group Holdings is described as good value based on its 0.5x P/S compared with the Hong Kong Real Estate industry average of 0.6x, and also against a peer average of 3.9x. It is also flagged as good value relative to an estimated fair P/S ratio of 0.6x, which suggests the current market multiple sits below a level that model-driven analysis indicates the shares could gravitate towards if assumptions hold.
Curious how that fair ratio is calculated and what it implies if sentiment turns? Take a closer look at the Explore the SWS fair ratio for Longfor Group Holdings.
Result: Price-to-sales of 0.5x (UNDERVALUED)
Still, Longfor Group Holdings carries clear risks, including ongoing annual revenue contraction and a recent net loss, despite sizeable HK$78.35b in reported sales.
Find out about the key risks to this Longfor Group Holdings narrative.
Another View: Longfor Group Holdings Through The DCF Lens
There is a second lens that presents Longfor Group Holdings as even cheaper. Our DCF model estimates a future cash flow value of HK$17.15 per share, compared with the current HK$6.23 price, which screens as materially undervalued. If cash flows track those inputs, is the gap a margin of safety or a warning on assumptions?
To understand how that cash flow estimate is built and what needs to go right for it to hold up, take a closer look at the Look into how the SWS DCF model arrives at its fair value..
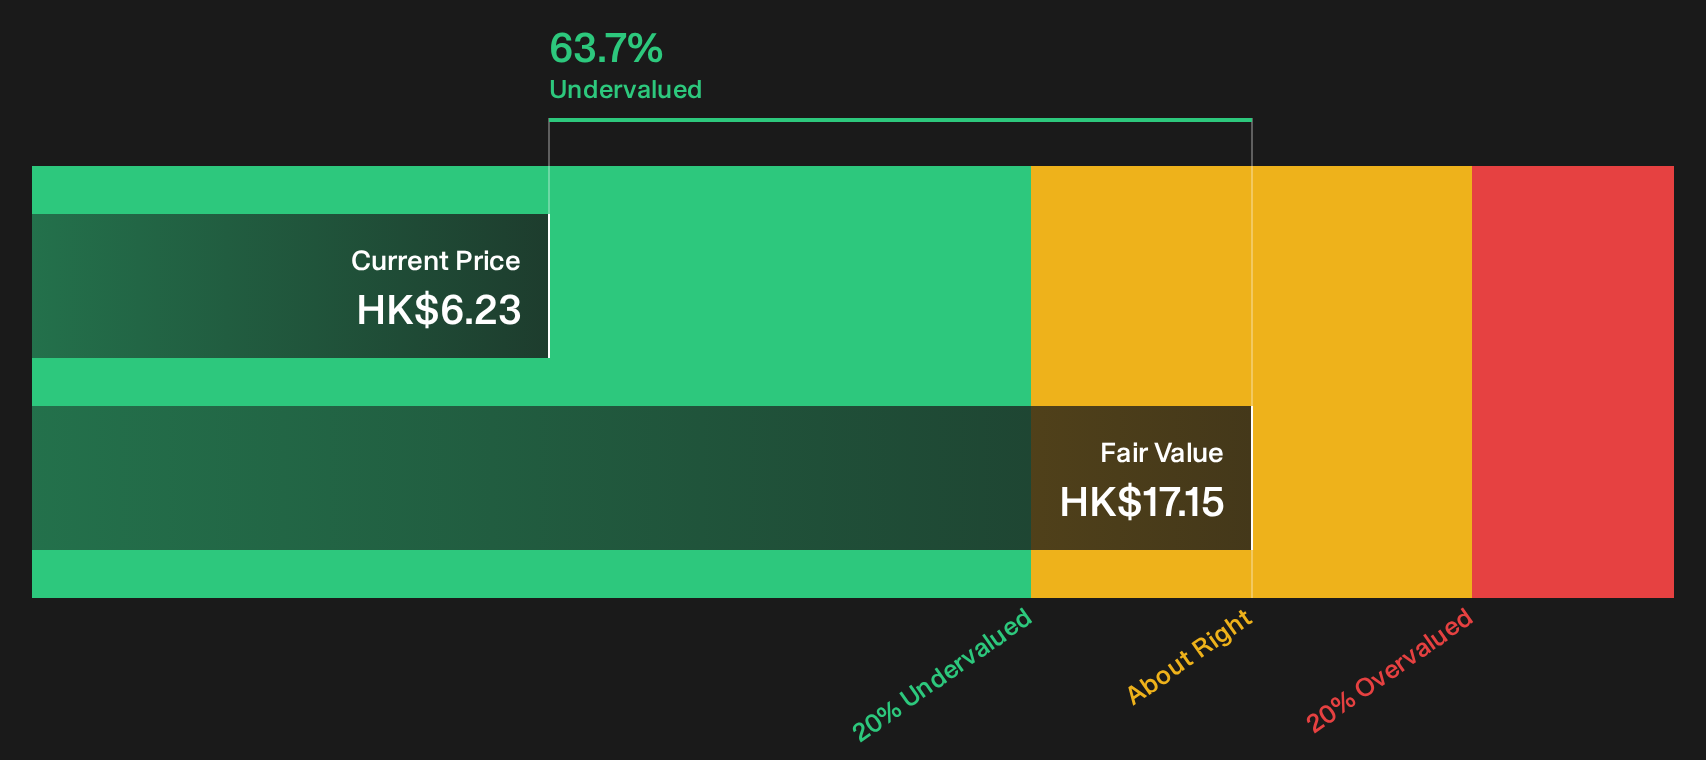
Simply Wall St performs a discounted cash flow (DCF) on every stock in the world every day (check out Longfor Group Holdings for example). We show the entire calculation in full. You can track the result in your watchlist or portfolio and be alerted when this changes, or use our stock screener to discover 252 high quality undervalued stocks. If you save a screener we even alert you when new companies match - so you never miss a potential opportunity.
Next Steps
Sentiment on Longfor Group Holdings is clearly mixed, with pressure on the track record but fresh valuation signals pulling in the other direction. Move fast, pull up the data, and weigh both sides of the story by reviewing the 3 key rewards and 1 important warning sign.
Looking For More Longfor Group Holdings Style Ideas?
If you only stop at Longfor Group Holdings, you risk missing other opportunities that match your risk, income, and value preferences across the market.
- Target resilient cash generators by scanning a 312 resilient stocks with low risk scores that prioritises financial strength when conditions get tougher.
- Spot value opportunities earlier by reviewing 617 high quality undiscovered gems that pair quality fundamentals with limited market attention.
- Build a more dependable income stream by assessing 165 dividend fortresses designed for investors who want yield with robust underlying businesses.
This article by Simply Wall St is general in nature. We provide commentary based on historical data and analyst forecasts only using an unbiased methodology and our articles are not intended to be financial advice. It does not constitute a recommendation to buy or sell any stock, and does not take account of your objectives, or your financial situation. We aim to bring you long-term focused analysis driven by fundamental data. Note that our analysis may not factor in the latest price-sensitive company announcements or qualitative material. Simply Wall St has no position in any stocks mentioned.
Have feedback on this article? Concerned about the content? Get in touch with us directly. Alternatively, email editorial-team@simplywallst.com