
Shougang Fushan Resources Group (SEHK:639) Earnings Growth Raises The Question Of Whether Value Is Left
Why Shougang Fushan Resources Group’s Latest Earnings Matter
Shougang Fushan Resources Group (SEHK:639) just reported half year results to June 30, 2026, with sales of HK$3,243.38 million and net income of HK$588.65 million, both higher than a year earlier.
That earnings update comes after a strong run in the share price, with Shougang Fushan Resources Group posting a 30 day share price return of 18.55% and a 1 year total shareholder return of 20.55%, building on a 5 year total shareholder return of 105.51%.
Scan how Shougang Fushan Resources Group’s earnings momentum compares with other resource producers by reviewing our hand picked list of 35 elite gold producer stocks in the same broader commodities space.
Shougang Fushan Resources Group now trades at a modest discount to analyst targets, even after the sharp recent rally. Is that a cautious market misread, or a fair reflection of the risks investors still see here?
Preferred P/E of 19.3x for Shougang Fushan Resources Group: Is it justified?
On the latest numbers, Shougang Fushan Resources Group trades on a P/E of 19.3x, which is higher than both its Hong Kong metals and mining peers and its own estimated fair level. For anyone watching the recent share price surge, that richer multiple raises a simple question: what exactly is being priced in?
The P/E ratio compares the current share price to earnings per share and gives a quick sense of how much investors are paying for each unit of profit. For a coking coal miner like Shougang Fushan Resources Group, that matters because earnings can be heavily affected by commodity prices and operating costs. The multiple often reflects what the market expects from future profitability rather than just the most recent results.
Here the stock trades on 19.3x earnings, while the Hong Kong metals and mining industry average sits at 11.4x. That is a clear premium. The estimated fair P/E is 8.4x, which is less than half of the current multiple and points to a level the valuation could move towards if sentiment or expectations cooled.
To see how that gap between market pricing and fair ratio is calculated in detail, review the Explore the SWS fair ratio for Shougang Fushan Resources Group.
Result: Price-to-earnings of 19.3x (OVERVALUED)
Still, Shougang Fushan Resources Group relies on a single commodity and a concentrated customer base, so shifts in steel demand or coking coal pricing could quickly challenge this valuation story.
Find out about the key risks to this Shougang Fushan Resources Group narrative.
Another View: Shougang Fushan Resources Group Through A DCF Lens
The P/E premium is only one story for Shougang Fushan Resources Group. Our DCF model estimates a future cash flow value of HK$1.9 per share, compared with the current HK$3.1 price. That implies the stock trades well above this cash flow based yardstick. So what are investors paying up for?
To understand how the SWS DCF model works in practice, and what would need to change for that gap to close, Look into how the SWS DCF model arrives at its fair value.
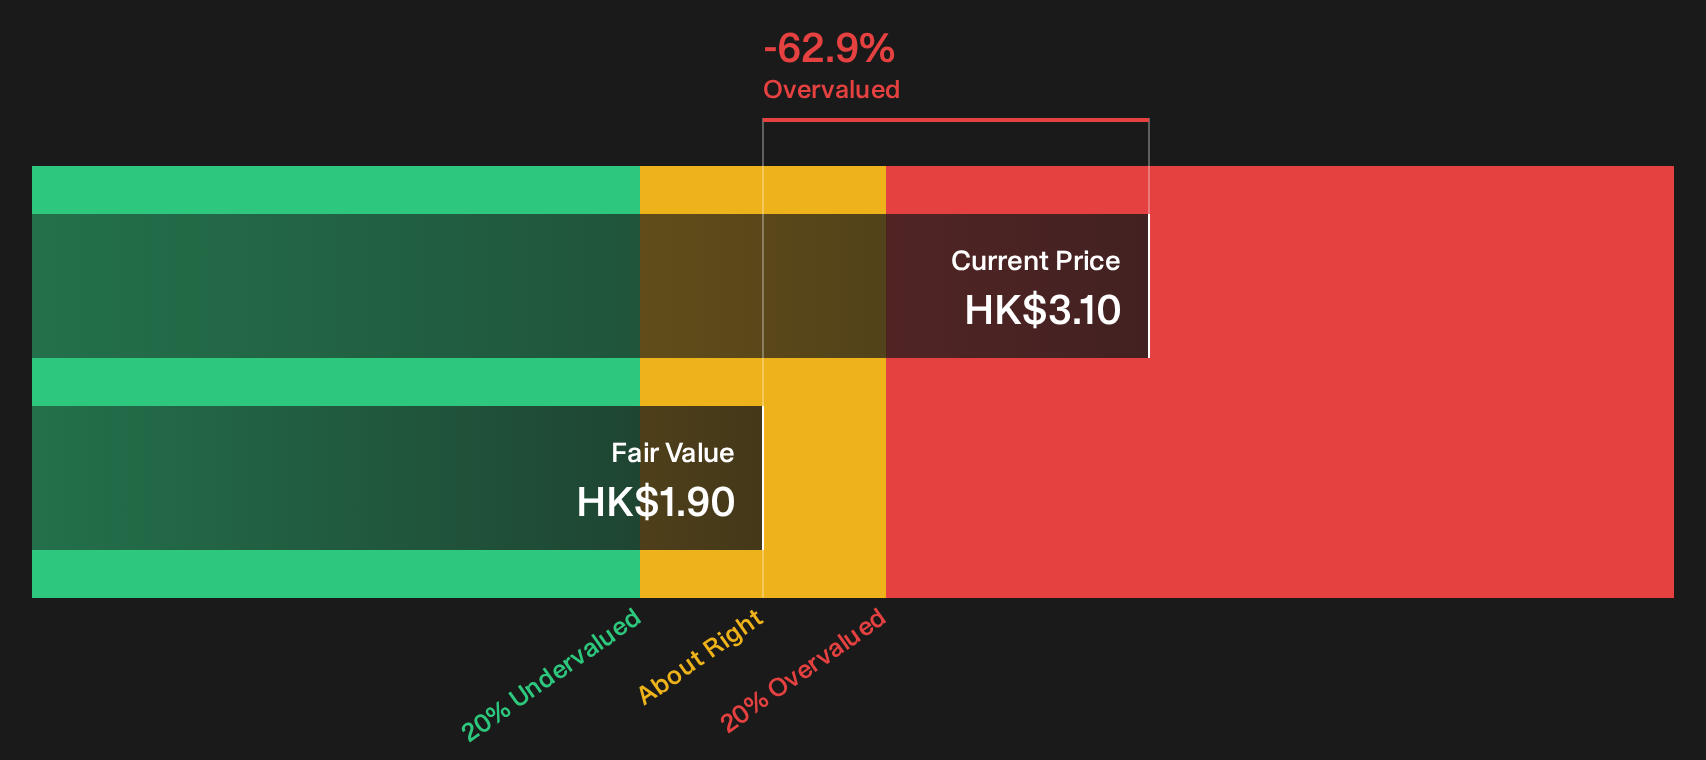
Simply Wall St performs a discounted cash flow (DCF) on every stock in the world every day (check out Shougang Fushan Resources Group for example). We show the entire calculation in full. You can track the result in your watchlist or portfolio and be alerted when this changes, or use our stock screener to discover 248 high quality undervalued stocks. If you save a screener we even alert you when new companies match - so you never miss a potential opportunity.
Next Steps
Sentiment around Shougang Fushan Resources Group is clearly mixed, so it may be sensible to move quickly, review the underlying numbers, and then weigh 1 key reward and 2 important warning signs
Looking for more Shougang Fushan Resources Group style ideas?
If Shougang Fushan Resources Group has you rethinking your watchlist, do not stop here. Broader idea hunting often uncovers better fits for your own risk and return preferences.
- Spot potential bargains early by reviewing our current pool of 616 high quality undiscovered gems that combine solid fundamentals with relatively low market attention.
- Prioritise resilience first and scan the list of solid balance sheet and fundamentals (193 results) to focus on businesses with financial structures that may better withstand shocks.
- Dial down volatility and concentrate on capital preservation by checking the 310 resilient stocks with low risk scores before the next wave of opportunities moves without you.
This article by Simply Wall St is general in nature. We provide commentary based on historical data and analyst forecasts only using an unbiased methodology and our articles are not intended to be financial advice. It does not constitute a recommendation to buy or sell any stock, and does not take account of your objectives, or your financial situation. We aim to bring you long-term focused analysis driven by fundamental data. Note that our analysis may not factor in the latest price-sensitive company announcements or qualitative material. Simply Wall St has no position in any stocks mentioned.
Have feedback on this article? Concerned about the content? Get in touch with us directly. Alternatively, email editorial-team@simplywallst.com