
Nordic American Tankers (NAT) Has The Market Looking Closer After Its Latest Update
Earnings jolt puts Nordic American Tankers in focus
Nordic American Tankers (NAT) is back on investor radar after reporting second quarter 2026 net income of US$68.34 million, swinging from a loss a year earlier, with earnings per share reaching US$0.32.
The recent earnings release has landed on top of a strong run in Nordic American Tankers, with a 30 day share price return of 10.53% and a year to date share price gain of 111.87%. This has fed into a 1 year total shareholder return of 157.29%, suggesting momentum has been building as expectations around earnings strength and risk have shifted.
Scan beyond Nordic American Tankers and see how other shipping and energy plays stack up in our hand picked 49 high quality undervalued stocks with solid cash flows and balance sheets.
The jump in earnings and a share price that has already more than doubled in 2026 set a high bar for Nordic American Tankers. Does the current valuation still leave enough upside for new buyers?
Price-to-earnings of 12.2x: Is it justified for Nordic American Tankers?
Nordic American Tankers now trades on a P/E of 12.2x, with the share price at $7.14, which puts it roughly in line with many listed energy carriers.
The P/E ratio compares the current share price to earnings per share and gives a quick sense of how much investors are paying for each dollar of profit. For a tanker owner with 20 Suezmax vessels, it is a simple way to weigh earnings power against what the market is charging for exposure to the crude oil shipping cycle.
Recent results show very strong profit growth over the past year, with earnings up by a very large multiple compared with the previous period and net profit margins at 33.3% compared with 4.4% a year earlier. Those figures are boosted by a one off gain of $52.2m, which means the current P/E may be capturing some temporary effects that do not necessarily reflect ongoing operations.
Against peers, the 12.2x P/E is below the US Oil and Gas industry average of 12.9x and also below the broader US market on 19x. At the same time, the stock is described as expensive relative to an estimated fair P/E of 9x. This points to a level the valuation could move toward if earnings and risk conditions evolve as implied by that model.
Investors weighing Nordic American Tankers can use that gap between 12.2x and the estimated fair 9x as a reference point for how much future profit strength is already reflected in the share price compared with what the regression based fair ratio suggests.
For a closer look at how that fair multiple is derived and how it compares with other stocks, check out the Explore the SWS fair ratio for Nordic American Tankers
Result: Price-to-earnings of 12.2x (OVERVALUED)
Still, Nordic American Tankers faces pressure if tanker day rates soften or if the one off gain that lifted margins is not repeated in future periods.
Find out about the key risks to this Nordic American Tankers narrative.
Another view on Nordic American Tankers valuation
The SWS DCF model paints a slightly different picture for Nordic American Tankers. On this view, the shares at $7.14 trade above an estimated future cash flow value of $6.77, which points to a modest premium. That gap raises a simple question for you. Are you comfortable paying extra for this earnings profile?
To understand how the cash flow assumptions work in practice, and what would need to change for that premium to close, Look into how the SWS DCF model arrives at its fair value.
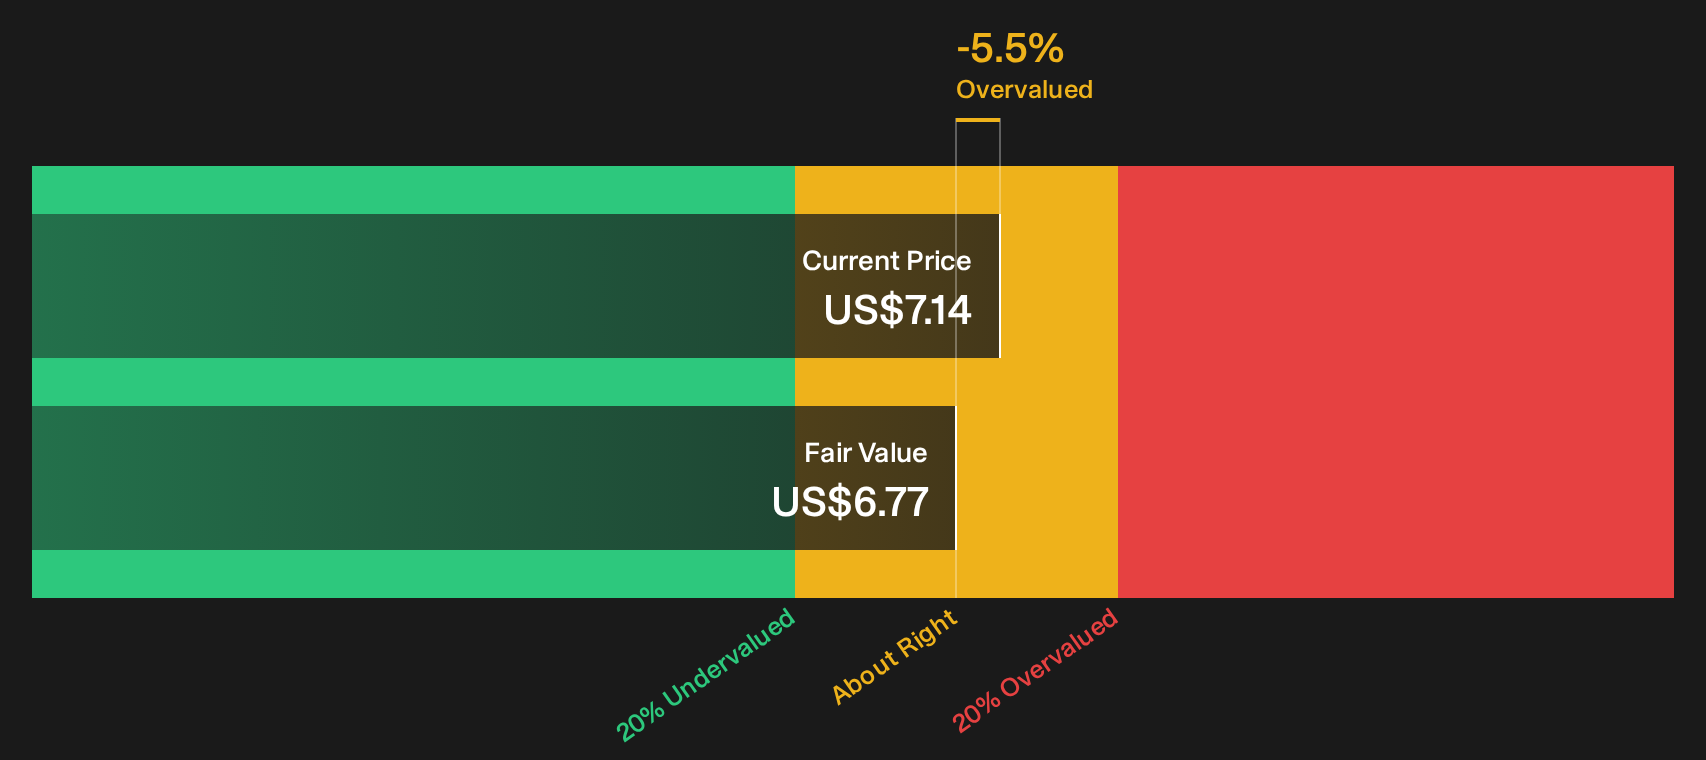
Simply Wall St performs a discounted cash flow (DCF) on every stock in the world every day (check out Nordic American Tankers for example). We show the entire calculation in full. You can track the result in your watchlist or portfolio and be alerted when this changes, or use our stock screener to discover 49 high quality undervalued stocks. If you save a screener we even alert you when new companies match - so you never miss a potential opportunity.
Next Steps
Sentiment around Nordic American Tankers is split, with clear risks on one side and meaningful potential rewards on the other. Move quickly, review the data and decide where you stand by checking the 2 key rewards and 4 important warning signs
Looking for more investment ideas beyond Nordic American Tankers?
If Nordic American Tankers has sharpened your appetite for opportunities, do not stop here. Broader idea hunting often reveals setups you did not know you needed.
- Target punchy upside potential with carefully filtered smaller companies by scanning the 22 elite penny stocks with strong financials that clear strict financial quality checks.
- Prioritise price discipline and balance sheet strength by reviewing the 49 high quality undervalued stocks that pair earnings support with solid fundamentals.
- Build a steadier income focused watchlist by assessing the 6 dividend fortresses offering higher yields backed by resilient cash generation.
This article by Simply Wall St is general in nature. We provide commentary based on historical data and analyst forecasts only using an unbiased methodology and our articles are not intended to be financial advice. It does not constitute a recommendation to buy or sell any stock, and does not take account of your objectives, or your financial situation. We aim to bring you long-term focused analysis driven by fundamental data. Note that our analysis may not factor in the latest price-sensitive company announcements or qualitative material. Simply Wall St has no position in any stocks mentioned.
Have feedback on this article? Concerned about the content? Get in touch with us directly. Alternatively, email editorial-team@simplywallst.com