
Roku (ROKU) Stock Looks Stretched On Its 91% Three Year Run
Roku stock has delivered a strong 91.1% gain over the past three years, yet the valuation checks do not point in a single direction, with the intrinsic value estimate suggesting upside while market-based multiples lean rich. The Discounted Cash Flow (DCF) view screens Roku as undervalued at the current share price, but the broader scoring framework still classifies it as low value overall.
- The share price return of 91.1% over three years already bakes in a lot of optimism, so any further gains may rely on the business turning that enthusiasm into durable cash generation.
- New moves into premium 4K OLED TVs and exclusive NWSL streaming rights can support long term platform engagement. The risk is that heavier content and hardware investment could compress free cash flow if user monetisation does not keep pace.
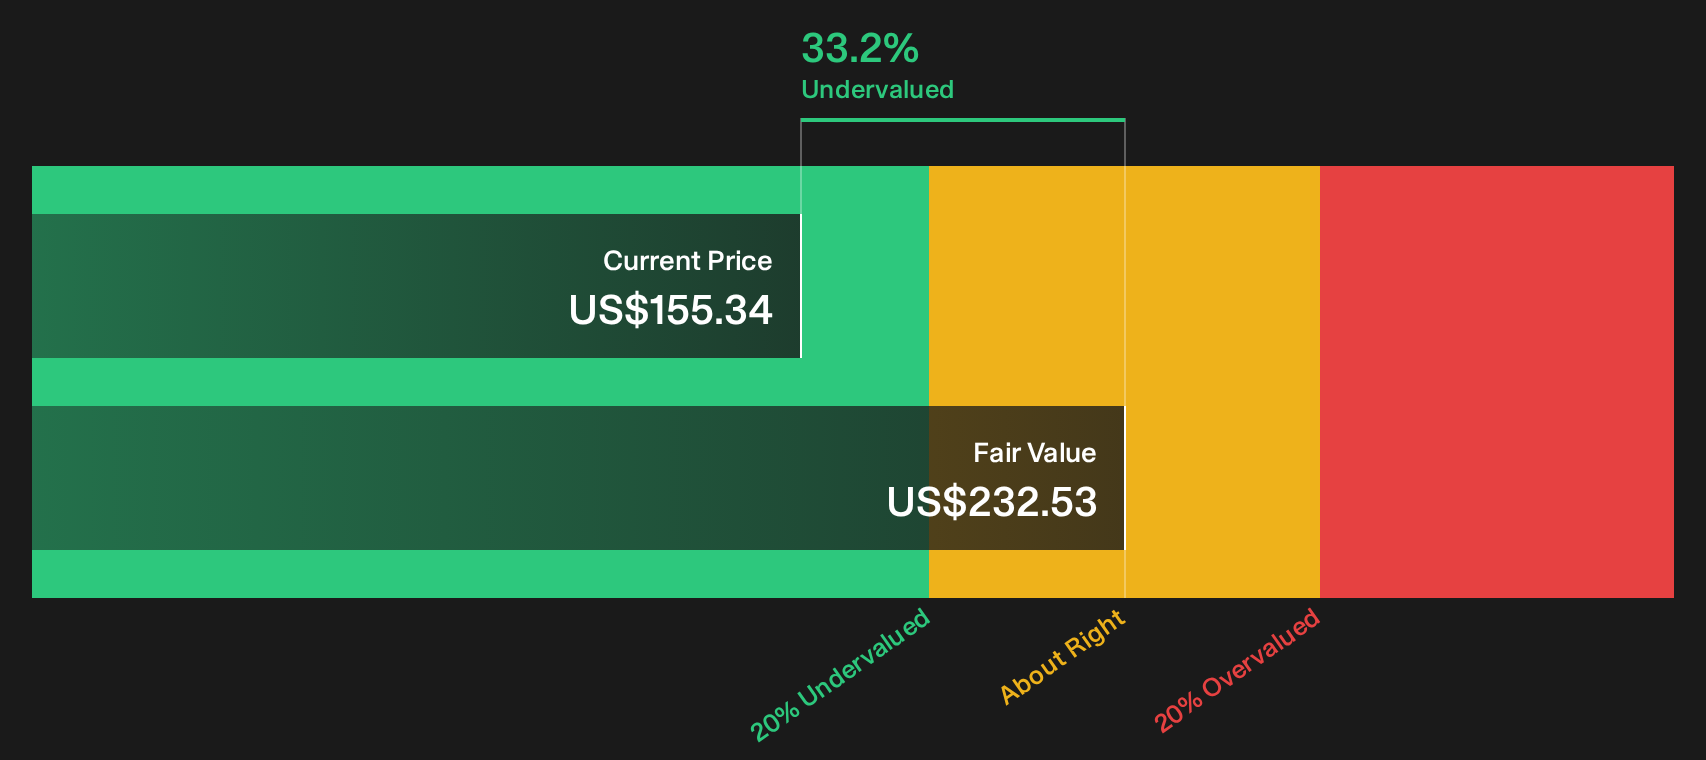
- With a value score of 2 out of 6, Roku currently looks more expensive than cheap on the broader cross checks, despite the Discounted Cash Flow (DCF) estimate pointing to an intrinsic value around 33.2% above the market price.
The issue now is whether Roku’s cash flow potential can close the gap between a richer-looking market multiple profile and an intrinsic value estimate that still flags the stock as undervalued.
Capture how Roku fits into the premium streaming and hardware race by comparing it with hand-picked peers screened for 49 high quality undervalued stocks.Does Roku Look Undervalued on Cash Flow?
The Discounted Cash Flow (DCF) model values Roku based on the cash it is expected to generate for shareholders over time. On this view, the latest twelve month Free Cash Flow of about $708 million is treated as a base that grows steadily rather than explosively, reflecting a business that is already generating cash while still investing heavily in its platform and hardware ambitions.
Applying those cash flow projections within a 2 Stage Free Cash Flow to Equity framework produces an estimated intrinsic value of around $233 per share, which stands about 33.2% above the current market price. Because the launch of Roku branded 4K OLED TVs and the exclusive NWSL Sunday night package both require ongoing spending before payoffs fully appear in cash generation, the fact that the DCF still indicates upside helps explain why some investors see room for the share price to align more closely with the cash flow profile.
On this cash flow based view, Roku stock appears undervalued relative to what the projected streams of cash support.
Our Discounted Cash Flow (DCF) analysis suggests Roku is undervalued by 33.2%. Track this in your watchlist or portfolio, or discover 49 more high quality undervalued stocks.
Is Roku Getting Expensive on Earnings?
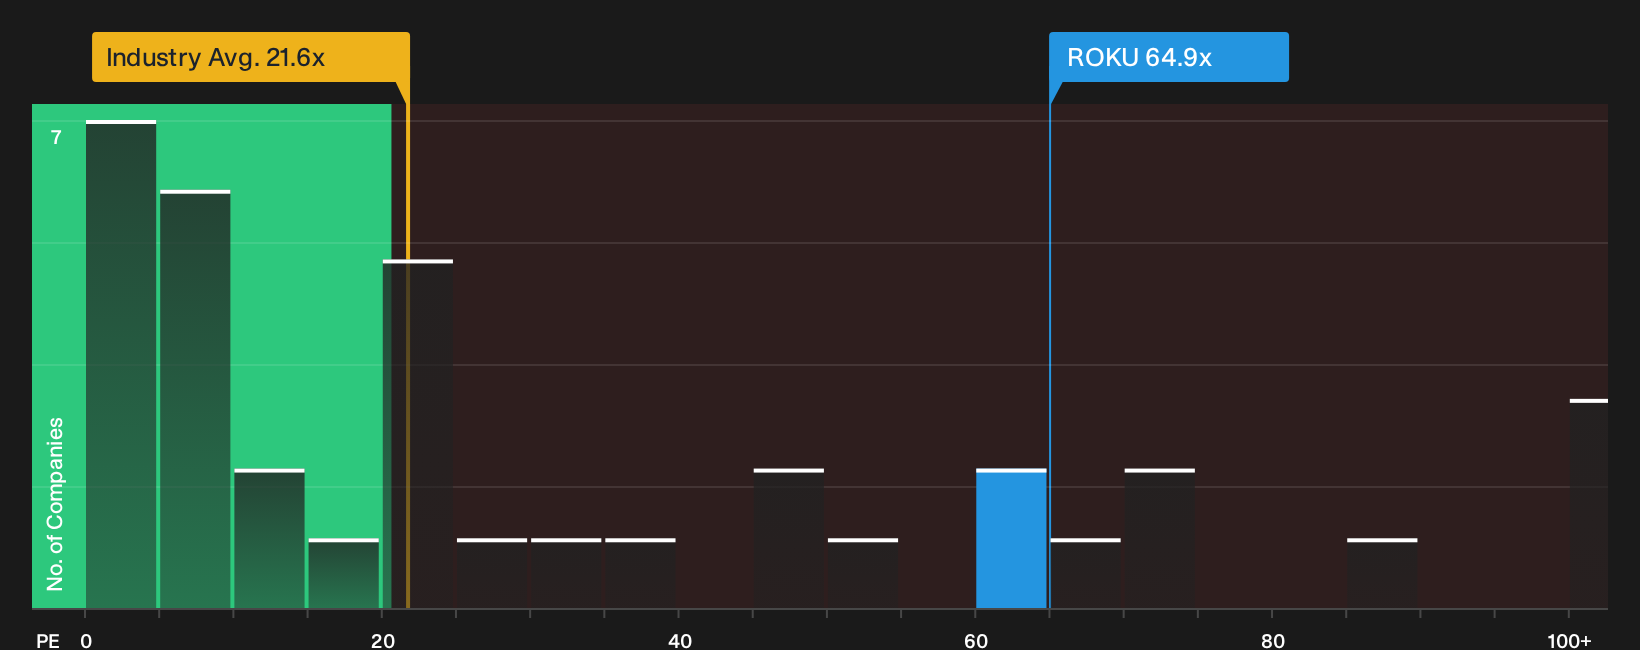
P/E suits Roku because earnings already sit in positive territory and give you a clear yardstick for what the market is paying for each dollar of profit. Right now the stock trades on about 64.9x earnings, which is well above the Entertainment sector average of roughly 21.6x and also ahead of a peer group closer to 50.4x.
The tailored fair P/E multiple for Roku is about 27.6x, which reflects its risk profile, margin structure and scale. That is less than half of where the shares currently change hands, so the gap suggests investors are paying a rich premium for the existing earnings base. Put simply, the current P/E assumes a lot is already going right for the business compared with what this framework would usually support.
On a pure P/E lens, Roku stock screens as overvalued relative to both its sector and the fair multiple implied by its fundamentals.
See what the numbers say about this price — find out in our valuation breakdown.
The Roku Narrative: What Would Justify Today's Price?
Roku's Simply Wall St Narratives pick up where the valuation split leaves you by spelling out which paths for growth, margins and earnings would need to play out for the shares to be worth much more or meaningfully less than today. Each scenario leans on a different mix of assumptions rather than a single multiple or model output, so you can track those expectations against Roku's actual results on the Community page as they arrive.
Roku now splits opinion between those focused on the streaming upside and those fixated on deal risk and ad dependence.
Bull case: roughly fairly valued
"Ongoing investments in proprietary content (e.g., The Roku Channel), self-service ad solutions, and performance marketing are boosting user engagement and attracting new cohorts of advertisers..."
Read the full Bull Case to see why Roku could be undervalued
Bear case: roughly fairly valued
"Roku's heavy dependence on digital ad revenues makes it highly exposed to the risk of stronger global privacy regulations and anti-tracking measures, which would directly erode the effectiveness and thus price of its targeted advertising formats..."
Read the full Bear Case to see why Roku could be overvalued
Do you think there's more to the story for Roku? Head over to our Community to see what others are saying!
The Bottom Line
Roku now presents a split verdict, with the Discounted Cash Flow (DCF) estimate pointing to meaningful intrinsic value upside while the P/E and other checks flag the shares as overvalued on market multiples. That gap comes down to timing and confidence. The intrinsic value view leans on future cash generation from the platform and hardware push, while the multiple view reflects how much optimism is already baked into today’s earnings and sector comparisons. The crux for investors is whether Roku can convert engagement and new initiatives into sustained, cash rich growth that justifies both the current premium and the DCF upside, rather than slipping into value trap territory.
This article by Simply Wall St is general in nature. We provide commentary based on historical data and analyst forecasts only using an unbiased methodology and our articles are not intended to be financial advice. It does not constitute a recommendation to buy or sell any stock, and does not take account of your objectives, or your financial situation. We aim to bring you long-term focused analysis driven by fundamental data. Note that our analysis may not factor in the latest price-sensitive company announcements or qualitative material. Simply Wall St has no position in any stocks mentioned.
Have feedback on this article? Concerned about the content? Get in touch with us directly. Alternatively, email editorial-team@simplywallst.com