
Interactive Brokers Group (IBKR), Why Is Fresh Attention Building Around It?
Interactive Brokers Group (IBKR) is pushing harder into the custodial business for financial advisors, pitching itself as “your custodian, not your competitor” and leaning on transparent pricing, cash yields, lending terms and global trading tools.
The recent custodial push comes after a strong run in the IBKR share price, with a year to date share price return of 34.29% and a 1 year total shareholder return of 45.03%. Momentum has built over multiple years, highlighted by a very large 5 year total shareholder return of more than 5x, even as short term moves around the latest US$90.28 level remain modest.
Scan the custodial and brokerage space beyond Interactive Brokers Group by checking our curated list of solid balance sheet and fundamentals (24 results), which includes firms that are also competing for advisor assets and client cash flows.
Interactive Brokers Group now trades below the average analyst target even after a strong multi year run. Is that a reasonable safety margin, or a signal that the market still sees real risks ahead as valuation comes into focus next?
Most Popular Narrative: 15.6% Undervalued
Against the last close of $90.28, the most followed narrative pegs Interactive Brokers Group’s fair value at $106.97, with that gap explained mainly by interest income and account growth assumptions.
The ongoing popularity of investing with global interest from investors who increasingly want broad portfolios and international access is expected to drive sustained account growth, attracting both individual and institutional investors and boosting overall revenue.
The partnership with HSBC for the HSBC WorldTrader offering powered by Interactive Brokers, along with the development of other potential client pipelines, points toward significant expansion opportunities in new markets, potentially increasing market share and diversifying revenue streams through commissions and interest income.
Read the complete narrative. Read the complete narrative.
Want to see what kind of revenue glide path, profit margin profile, and future earnings multiple are baked into that fair value label? The narrative leans heavily on compounded top line expansion, fatter profitability, and a premium P/E that together have to carry a lot of weight. Curious how those moving parts are stitched into a single discounted cash flow style roadmap for Interactive Brokers Group?
Result: Fair Value of $106.97 (UNDERVALUED)
Have a read of the narrative in full and understand what's behind the forecasts.
Still, the Interactive Brokers Group narrative leans heavily on trading activity and net interest income, so weaker volumes or lower rates could quickly test those assumptions.
Find out about the key risks to this Interactive Brokers Group narrative.
Another View on Interactive Brokers Group Valuation
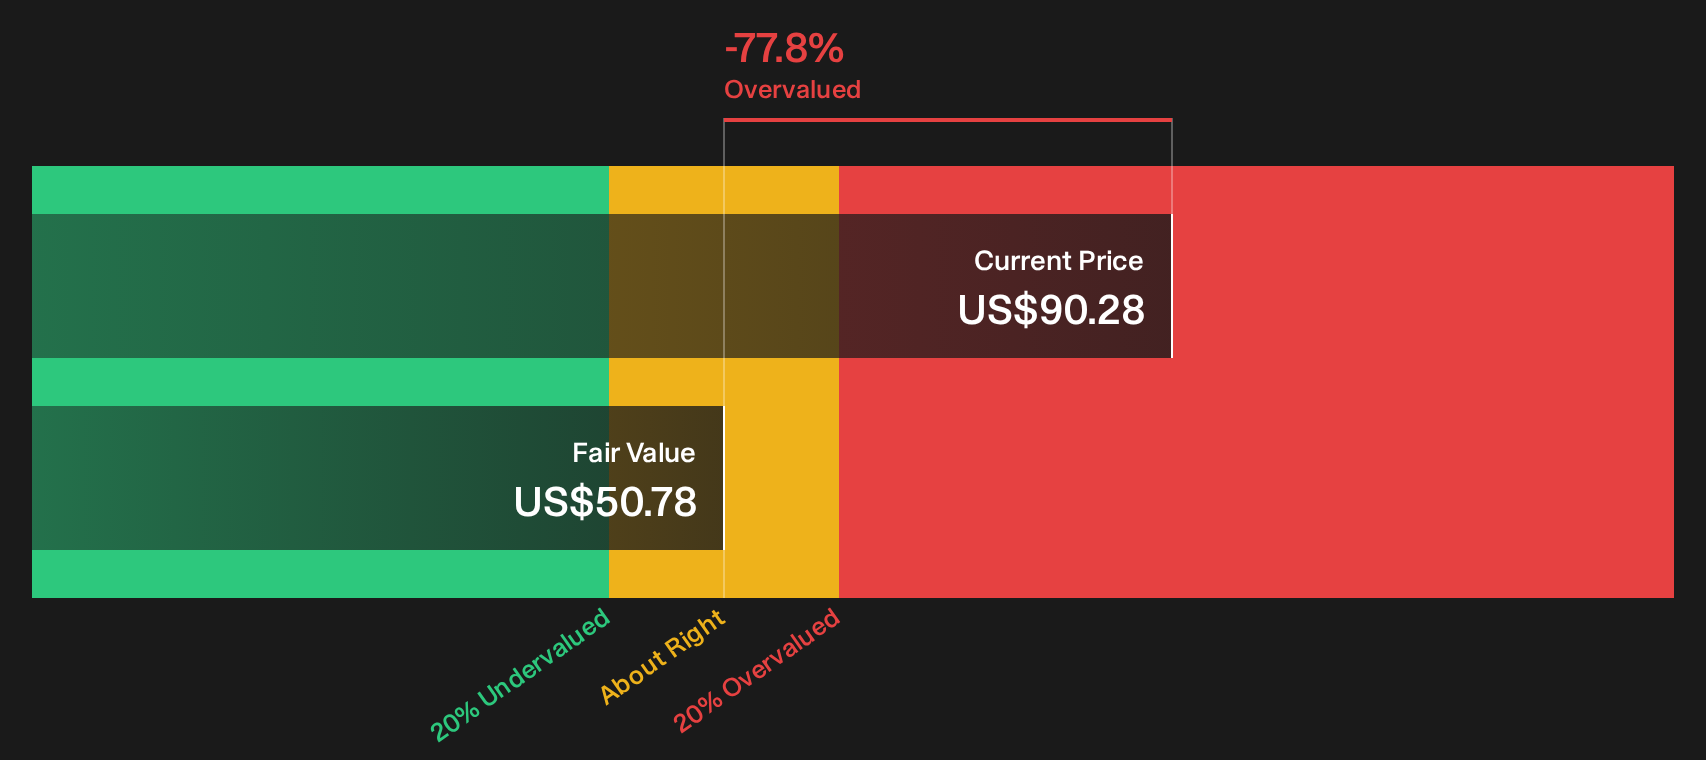
The analyst narrative tags Interactive Brokers Group as 15.6% undervalued at $106.97, but the SWS DCF model tells a very different story. On that framework, IBKR at $90.28 trades well above an estimated future cash flow value of $50.78, which screens as overvalued rather than cheap. That kind of gap can matter when you think about how much of your thesis leans on high earnings multiples versus long term cash generation. Which lens do you trust more for IBKR right now?
Look into how the SWS DCF model arrives at its fair value.
Next Steps
If this mix of optimism and caution around Interactive Brokers Group has you thinking, act promptly and review the underlying data yourself. To see what investors are focused on in the current thesis, start with the 3 key rewards.
Looking for more investment ideas beyond Interactive Brokers Group?
Interactive Brokers Group can anchor your watchlist, but your next strong idea may come from a very different corner of the market. Do not leave that potential on the table.
- Target steady compounders by using the 31 high quality undervalued stocks, which screens for financially strong businesses trading below their estimated worth.
- Lock in income first by scanning the 6 dividend fortresses, which highlights companies offering robust yields with the potential for dependable cash returns.
- Raise your quality filter by checking the 10 resilient stocks with low risk scores, which focuses on resilient businesses with lower overall risk scores.
This article by Simply Wall St is general in nature. We provide commentary based on historical data and analyst forecasts only using an unbiased methodology and our articles are not intended to be financial advice. It does not constitute a recommendation to buy or sell any stock, and does not take account of your objectives, or your financial situation. We aim to bring you long-term focused analysis driven by fundamental data. Note that our analysis may not factor in the latest price-sensitive company announcements or qualitative material. Simply Wall St has no position in any stocks mentioned.
Have feedback on this article? Concerned about the content? Get in touch with us directly. Alternatively, email editorial-team@simplywallst.com