
Can BlackRock (BLK) Stay Reasonable As AI And Crypto Expand?
BlackRock has delivered a strong 64.4% gain over the past three years. However, current valuation checks point to a stock that looks roughly in line with its intrinsic value estimate, while standard earnings multiples lean on the expensive side. Recent short term share price weakness sits alongside an Excess Returns intrinsic value model that suggests the stock is fairly valued, which leaves investors weighing how much to pay for that past compounding.
- Over the past three years, BlackRock has returned 64.4%, which makes the recent, more subdued shorter term performance more noticeable for anyone who bought in late.
- AI adoption across BlackRock's operations and the expansion of its digital assets and model portfolio offerings can support long term fee and platform economics. At the same time, greater exposure to crypto and new product lines may add regulatory and reputational risk that investors need to price in.
- Based on a value score of 3 and an intrinsic value estimate that looks fairly valued against a richer market multiple read, the overall picture for BlackRock is a mixed one rather than a clear bargain or clear overvaluation.
The issue now is whether BlackRock's current share price already reflects the intrinsic value implied by the Excess Returns model and its growth initiatives, or if the market is leaning too far toward optimism.
Spot opportunities beyond BlackRock by scanning a curated set of resilient, fundamentals driven businesses in the solid balance sheet and fundamentals stocks screener (24 results).Where Does BlackRock Sit on Excess Returns?
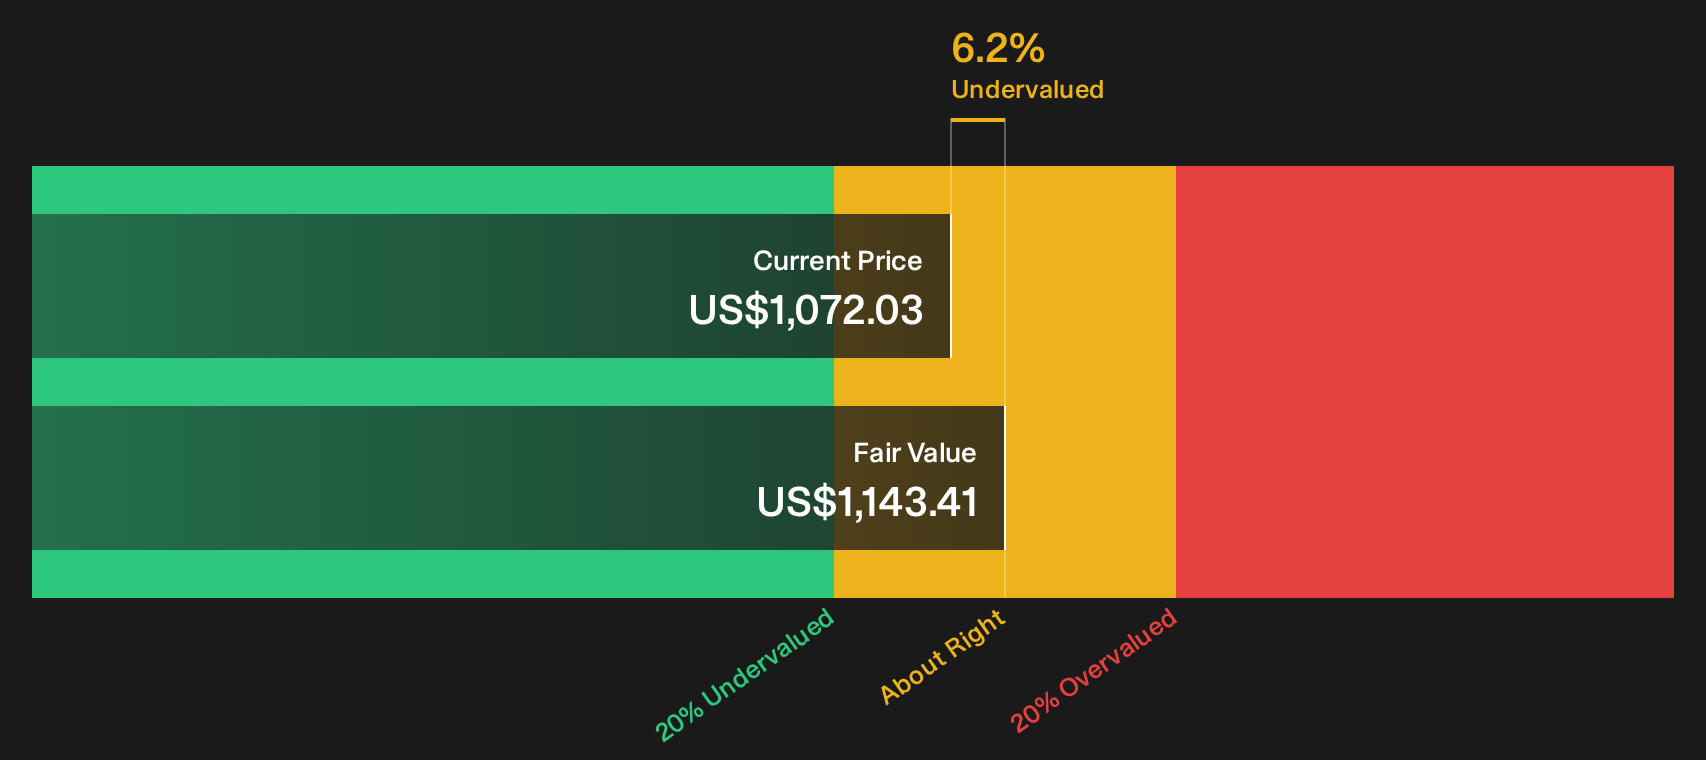
The Excess Returns model starts by asking whether BlackRock earns more on its equity than shareholders require. With an average return on equity of 16.05% and a cost of equity of $32.27 per share, the framework estimates an excess return of $32.16 on each $371.70 of book value. That feeds into a stable earnings power of $64.43 per share and a stable book value of $401.57 per share, both grounded in analyst expectations rather than aggressive growth assumptions.
Using those inputs, the model arrives at an intrinsic value of $1,143 per share, which sits around 6.2% above the current share price. This points to a stock that screens roughly in line with its estimated worth rather than at a steep discount. Because BlackRock is pushing further into AI enabled processes and digital assets, including Bitcoin and Ethereum products, the modest discount can be interpreted as the market giving some credit for that expansion while also limiting how much it is willing to pay for the additional regulatory and product risk.
Taken together, the Excess Returns analysis indicates that BlackRock appears to be trading close to its estimated intrinsic value, with only a small discount currently implied.
BlackRock is fairly valued according to our Excess Returns, but this can change at a moment's notice. Track the value in your watchlist or portfolio and be alerted on when to act.
Is BlackRock Getting Expensive on Earnings?
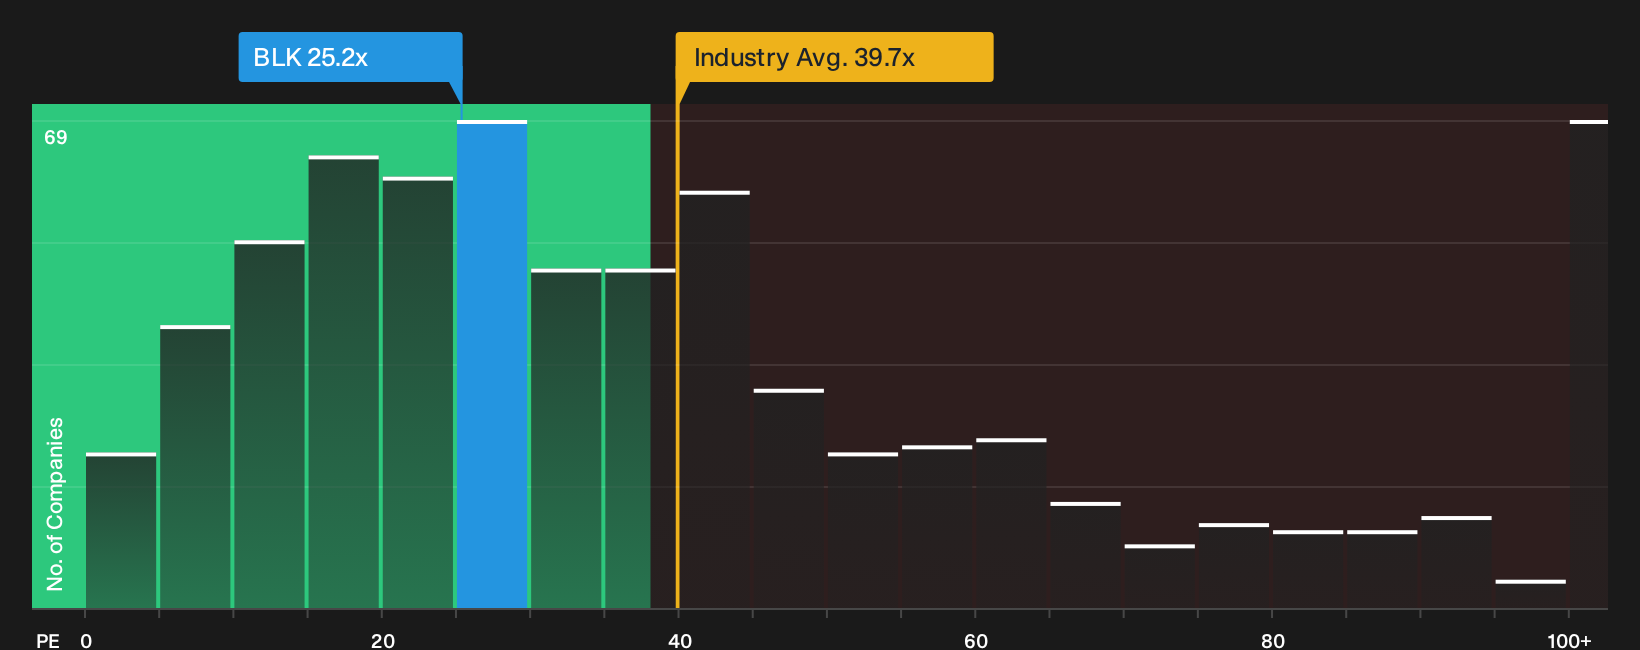
P/E is a natural yardstick for BlackRock because the business is built around relatively steady fee income on assets under management. On this measure, the shares trade on about 25.2x earnings, compared with roughly 23.8x for peers and 39.7x for the broader Capital Markets industry.
The fair P/E ratio from the model sits nearer 20.1x, which is materially lower than the current multiple and implies investors are paying a premium to what the company’s profile would typically justify. That premium leaves BlackRock looking overvalued on earnings relative to its tailored fair multiple, even before considering that the stock already appears close to intrinsic value under the Excess Returns framework.
On balance, BlackRock stock screens as overvalued on its P/E ratio, with investors paying a richer price for each dollar of earnings than the model suggests is warranted.
See what the numbers say about this price — find out in our valuation breakdown.
The BlackRock Narrative: What Would Justify Today's Price?
Simply Wall St Narratives for BlackRock pick up where the valuation puzzle leaves you by spelling out which future paths for growth, profitability and earnings would need to play out for the shares to look meaningfully cheap or expensive relative to today’s price. Each scenario links its number to a clear view on how BlackRock's revenue trajectory, margin profile and key risks might evolve, giving you something concrete to revisit as fresh information lands.
One of the top community narratives on BlackRock: 19% undervalued
"BlackRock's expansion into private markets through acquisitions like HPS Investment Partners, GIP, and ElmTree positions the company to capitalize on the secular shift of institutional assets into alternatives and infrastructure..."
Read one of the top narratives on BlackRock
Do you think there's more to the story for BlackRock? Head over to our Community to see what others are saying!
The Bottom Line
On the current numbers, BlackRock looks roughly aligned with its intrinsic value estimate, while the P/E view leans toward the stock being overvalued. That mix ties back to the Excess Returns work focusing on earnings power and required returns, while the richer multiple reflects how much investors are willing to pay for perceived resilience and optionality. For you, the key question is whether fee growth, AI enabled efficiency and newer areas like digital assets justify paying that premium. The crux of the debate is whether those initiatives drive durable economics or whether today’s valuation already absorbs most of that upside while still carrying the extra risk.
This article by Simply Wall St is general in nature. We provide commentary based on historical data and analyst forecasts only using an unbiased methodology and our articles are not intended to be financial advice. It does not constitute a recommendation to buy or sell any stock, and does not take account of your objectives, or your financial situation. We aim to bring you long-term focused analysis driven by fundamental data. Note that our analysis may not factor in the latest price-sensitive company announcements or qualitative material. Simply Wall St has no position in any stocks mentioned.
Have feedback on this article? Concerned about the content? Get in touch with us directly. Alternatively, email editorial-team@simplywallst.com