
Asian Market Value Stocks That May Be Trading Below Their Estimated Worth
As Asian markets navigate a complex landscape marked by geopolitical tensions and fluctuating oil prices, investors are keenly observing the potential impacts on regional economies and indices. In this environment, identifying stocks that may be trading below their intrinsic value becomes crucial for those looking to capitalize on potential market inefficiencies.
Top 10 Undervalued Stocks Based On Cash Flows In Asia
| Name | Current Price | Fair Value (Est) | Discount (Est) |
| Thai Vegetable Oil (SET:TVO) | THB27.25 | THB51.97 | 47.6% |
| Shizuki Electric (TSE:6994) | ¥1177.00 | ¥2288.07 | 48.6% |
| Rakus (TSE:3923) | ¥1039.00 | ¥2065.16 | 49.7% |
| Niterra (TSE:5334) | ¥7242.00 | ¥13772.86 | 47.4% |
| Leopalace21 (TSE:8848) | ¥655.00 | ¥1299.18 | 49.6% |
| Ichikoh Industries (TSE:7244) | ¥557.00 | ¥1070.24 | 48% |
| Dongwon Industries (KOSE:A006040) | ₩37500.00 | ₩71320.85 | 47.4% |
| CMOC Group (SHSE:603993) | CN¥19.01 | CN¥36.05 | 47.3% |
| BuySell TechnologiesLtd (TSE:7685) | ¥2899.00 | ¥5579.90 | 48% |
| AK Medical Holdings (SEHK:1789) | HK$4.935 | HK$9.64 | 48.8% |
Underneath we present a selection of stocks filtered out by our screen.
Ningbo Orient Wires & CablesLtd (SHSE:603606)
Overview: Ningbo Orient Wires & Cables Co., Ltd. is involved in the research, development, manufacturing, and sale of submarine and terrestrial cable products both in China and internationally, with a market cap of CN¥28.35 billion.
Operations: The company generates revenue through the production and distribution of a variety of submarine and terrestrial cable products across domestic and international markets.
Estimated Discount To Fair Value: 37.5%
Ningbo Orient Wires & Cables Ltd. is trading at CN¥34.49, significantly below its estimated future cash flow value of CN¥55.21, indicating undervaluation based on cash flows. Despite a forecasted earnings growth of 26.2% annually, slightly below the market average, it remains attractive due to strong recent performance with H1 2026 net income rising to CN¥564.79 million from CN¥472.96 million last year and good relative value compared to peers and industry standards.
- Our expertly prepared growth report on Ningbo Orient Wires & CablesLtd implies its future financial outlook may be stronger than recent results.
- Click here and access our complete balance sheet health report to understand the dynamics of Ningbo Orient Wires & CablesLtd.

Kingnet Network (SZSE:002517)
Overview: Kingnet Network Co., Ltd. is involved in the development, operation, and distribution of mobile games both in China and internationally, with a market cap of CN¥37.54 billion.
Operations: The company's revenue primarily comes from its Internet Software and Services segment, totaling CN¥7.54 billion.
Estimated Discount To Fair Value: 43.6%
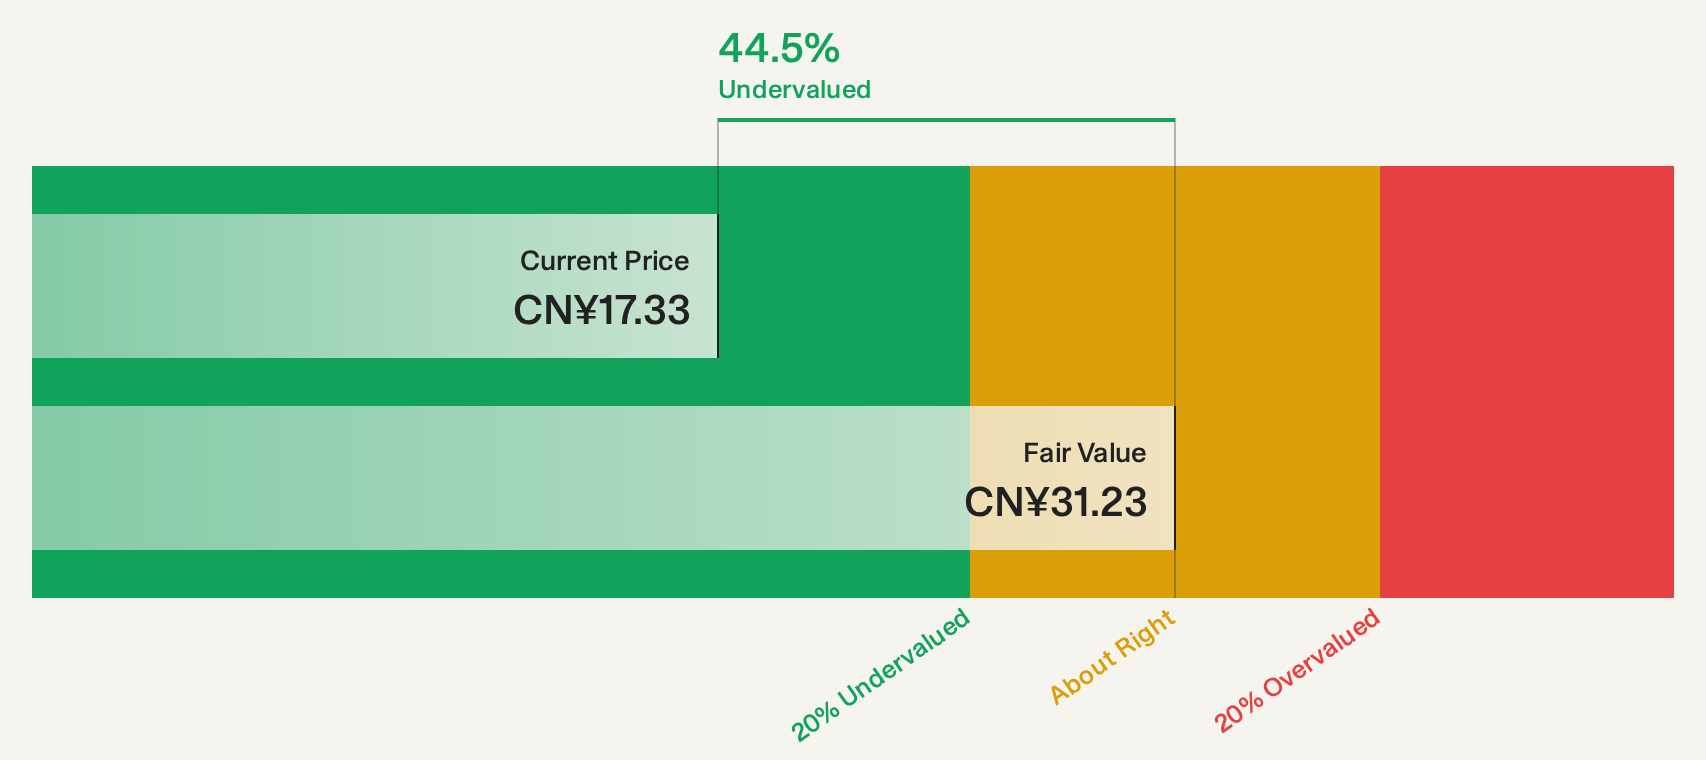
Kingnet Network Co., Ltd. is trading at CN¥17.7, well below its estimated future cash flow value of CN¥31.39, highlighting its undervaluation based on cash flows. Recent earnings results show a strong performance with H1 2026 net income increasing to CNY 1,428.32 million from CNY 950.04 million last year, supporting its potential for growth despite slower revenue and profit growth forecasts compared to the market average in China.
- Our earnings growth report unveils the potential for significant increases in Kingnet Network's future results.
- Dive into the specifics of Kingnet Network here with our thorough financial health report.
MINEBEA MITSUMI (TSE:6479)
Overview: MINEBEA MITSUMI Inc. is a global manufacturer and supplier of machinery components, electronic devices, automotive and industrial machinery, and home security products with a market cap of ¥1.36 trillion.
Operations: The company's revenue is primarily derived from its Semiconductors & Electronics segment at ¥613.46 billion, followed by Motor, Lighting & Sensing at ¥491.17 billion, Access Solutions at ¥338.29 billion, and Precision Technologies contributing ¥305.12 billion.
Estimated Discount To Fair Value: 35.9%
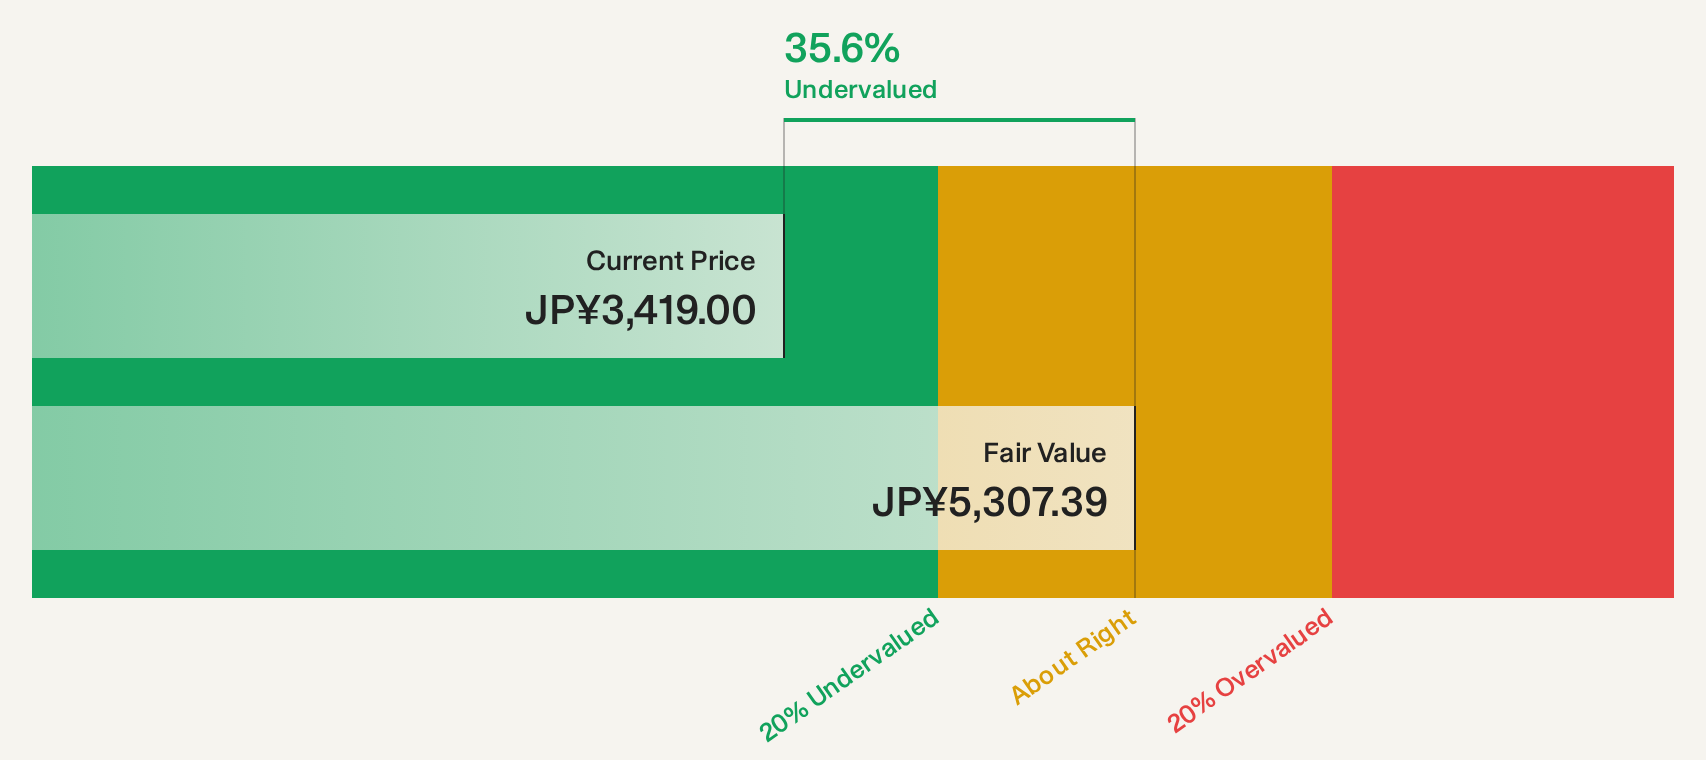
MINEBEA MITSUMI is trading at ¥3,377, significantly below its estimated future cash flow value of ¥5,270.45, indicating undervaluation. Despite a volatile share price recently and forecasted slower growth in revenue (2.2% annually) and earnings (2% annually) compared to the Japanese market averages, recent financials show robust performance with Q1 2026 net income rising to ¥21.30 billion from last year's ¥10.89 billion, reflecting strong profit growth over the past year.
- According our earnings growth report, there's an indication that MINEBEA MITSUMI might be ready to expand.
- Click here to discover the nuances of MINEBEA MITSUMI with our detailed financial health report.
Seize The Opportunity
- Get an in-depth perspective on all 90 Undervalued Asian Stocks Based On Cash Flows by using our screener here.
- Have you diversified into these companies? Leverage the power of Simply Wall St's portfolio to keep a close eye on market movements affecting your investments.
- Discover a world of investment opportunities with Simply Wall St's free app and access unparalleled stock analysis across all markets.
Want To Explore Some Alternatives?
- Explore high-performing small cap companies that haven't yet garnered significant analyst attention.
- Diversify your portfolio with solid dividend payers offering reliable income streams to weather potential market turbulence.
- Fuel your portfolio with companies showing strong growth potential, backed by optimistic outlooks both from analysts and management.
This article by Simply Wall St is general in nature. We provide commentary based on historical data and analyst forecasts only using an unbiased methodology and our articles are not intended to be financial advice. It does not constitute a recommendation to buy or sell any stock, and does not take account of your objectives, or your financial situation. We aim to bring you long-term focused analysis driven by fundamental data. Note that our analysis may not factor in the latest price-sensitive company announcements or qualitative material. Simply Wall St has no position in any stocks mentioned.
Have feedback on this article? Concerned about the content? Get in touch with us directly. Alternatively, email editorial-team@simplywallst.com