
Atlanticus (ATLC) Stock Trades At a Discount to Earnings Value
Atlanticus Holdings has nearly tripled over the past three years, yet valuation checks send a mixed message. The Excess Returns intrinsic value estimate suggests the stock is roughly in line with fair value, while market multiples still flag it as potentially cheap.
- The share price is up 194.6% over three years, which puts pressure on any thesis that still treats Atlanticus Holdings as an obvious bargain.
- Future credit performance and funding costs can support or erode returns on its lending portfolio, so profitability resilience is a key driver for how the market prices the stock.
- The broader checks give Atlanticus Holdings a value score of 2 out of 6, which leans expensive rather than a clear value idea.
The issue now is whether Atlanticus Holdings at around US$92.60 offers enough valuation support after this strong three year run, or whether most of the easy upside has already been taken.
See how Atlanticus Holdings compares with other lenders that appear potentially mispriced by reviewing our hand picked list of 31 high quality undervalued stocks.
Does Atlanticus Holdings Look Fairly Valued on Excess Returns?
The Excess Returns model asks whether Atlanticus Holdings can keep earning more on its equity base than investors require as compensation for risk. That is the core test here.
Atlanticus Holdings is modeled with book value of $46.27 per share and a stable earnings power of $9.36 per share, based on its median return on equity over the past five years. Against a cost of equity of $6.09 per share, that implies excess return of $3.27 for every $46.27 of equity, with an average return on equity of 19.27%. The framework assumes that book value edges up toward a stable level of $48.58 per share, using estimates from two analysts.
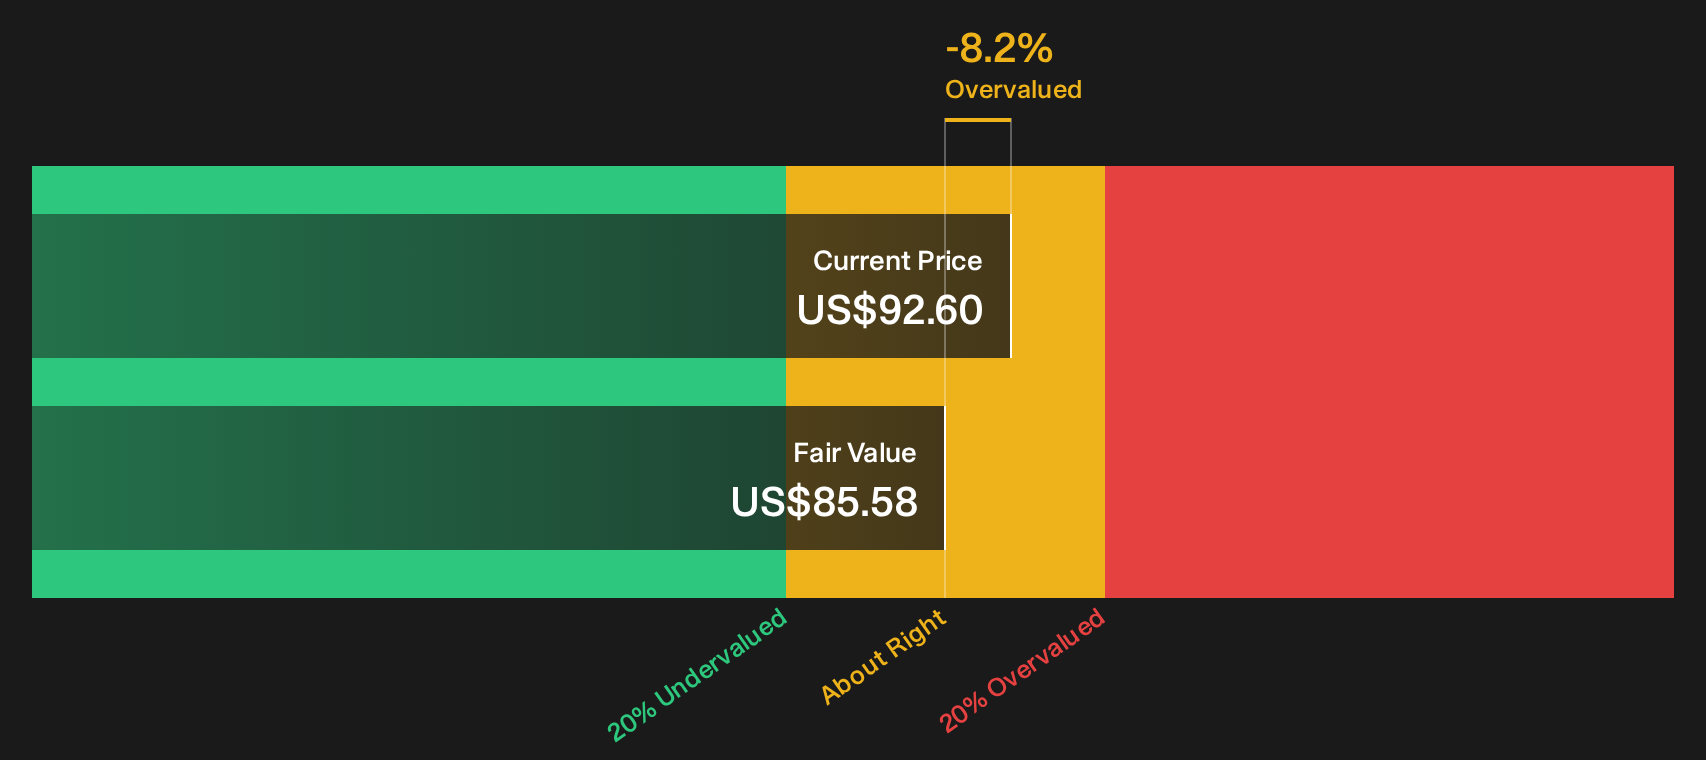
Putting these inputs together, the Excess Returns model points to an intrinsic value of about $85.58 per share, compared with the current price around $92.60. That gap implies the stock screens as roughly 8.2% overvalued on this approach.
On this Excess Returns view, Atlanticus Holdings looks about fairly valued, with only a slight tilt toward being overvalued at today’s price.
Atlanticus Holdings is fairly valued according to our Excess Returns, but this can change at a moment's notice. Track the value in your watchlist or portfolio and be alerted on when to act.
Is Atlanticus Holdings Still Cheap on Earnings?
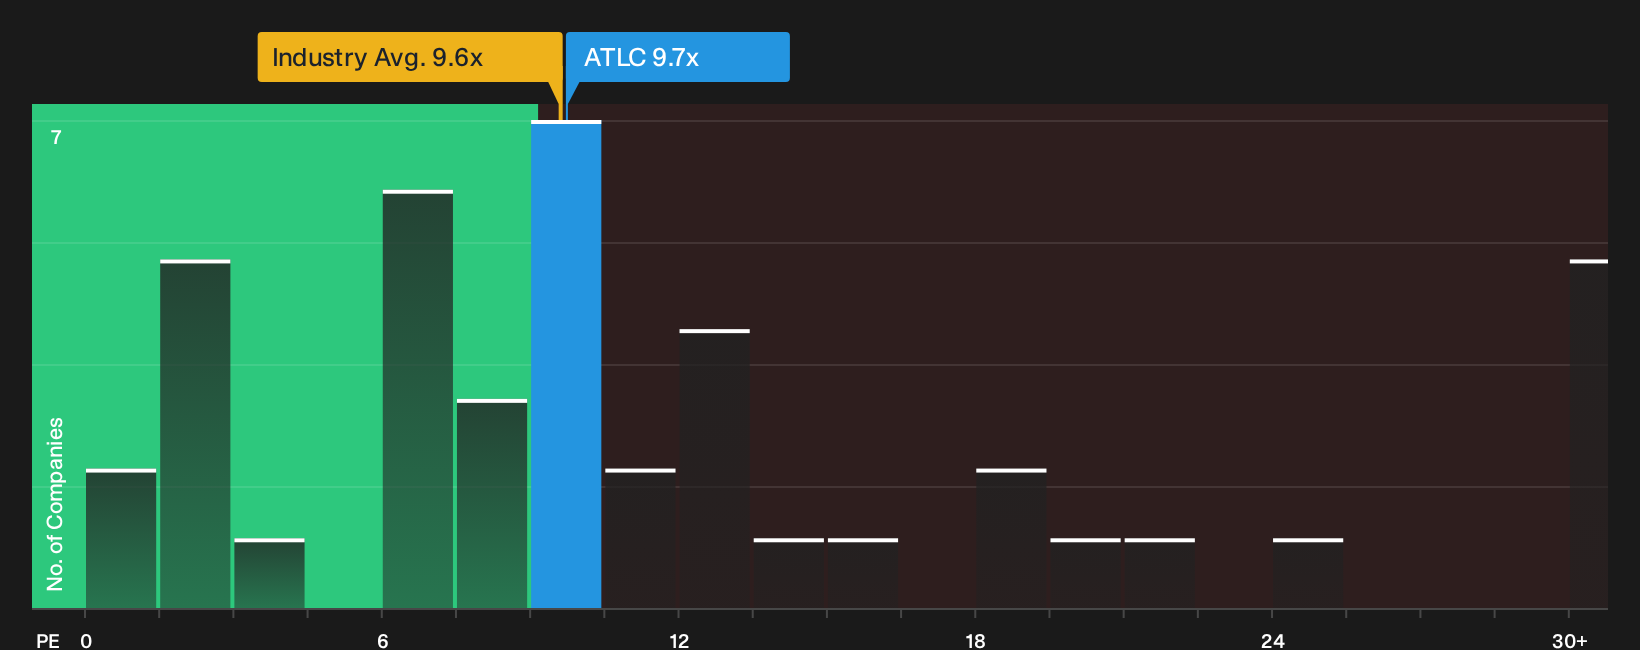
The P/E ratio works well for Atlanticus Holdings because earnings are the main engine behind how investors are valuing this lender today. On this metric, the stock trades at about 9.7x earnings, which is close to the Consumer Finance industry average of roughly 9.6x and only slightly below the 10.4x peer group level.
The fair P/E multiple from the broader model is about 20.3x. This is more than double the current P/E and indicates that the market is pricing Atlanticus Holdings at a sizeable discount to what this framework implies based on its risk profile, profitability and sector.
On the P/E yardstick alone, Atlanticus Holdings appears undervalued compared with the multiple implied by the fair ratio model.
See what the numbers say about this price — find out in our valuation breakdown.
The Atlanticus Holdings Narrative: What Would Justify Today's Price?
Narratives pick up where the valuation gap on Atlanticus Holdings' P/E and Excess Returns models leaves off, by explaining what would need to happen to growth, profitability and earnings for the stock to justify a meaningfully higher or lower price than today. These scenarios are available on Simply Wall St's Community page. Rather than a single multiple or model output, each narrative lays out its assumptions so you can compare them with actual results as they are reported.
One of the top community narratives on Atlanticus Holdings: 31% undervalued
"The acquisition and integration of Mercury Financial has roughly doubled the balance sheet to about US$7b and brought a US$3b portfolio under Atlanticus portfolio management methods…"
Read one of the top narratives on Atlanticus Holdings
Do you think there's more to the story for Atlanticus Holdings? Head over to our Community to see what others are saying!
The Bottom Line
Atlanticus Holdings screens as roughly in line with intrinsic value on the Excess Returns estimate, while the P/E comparison leans toward the shares looking undervalued relative to peers. That split comes from the intrinsic view focusing on the capital intensity and funding demands of the lending model, while the multiple view leans more on how the market is pricing earnings and growth expectations across comparable lenders. Broader valuation checks are weak, so that single P/E signal does not on its own make Atlanticus Holdings a clear value idea. The real swing factor from here is whether credit performance and funding costs keep earnings resilient enough to justify any further re rating.
This article by Simply Wall St is general in nature. We provide commentary based on historical data and analyst forecasts only using an unbiased methodology and our articles are not intended to be financial advice. It does not constitute a recommendation to buy or sell any stock, and does not take account of your objectives, or your financial situation. We aim to bring you long-term focused analysis driven by fundamental data. Note that our analysis may not factor in the latest price-sensitive company announcements or qualitative material. Simply Wall St has no position in any stocks mentioned.
Have feedback on this article? Concerned about the content? Get in touch with us directly. Alternatively, email editorial-team@simplywallst.com