
Sterling Infrastructure (STRL) Stock Still Looks Below Fair Value On Cash Flow
Sterling Infrastructure has delivered a very large 5 year gain while current valuation checks, including an intrinsic value estimate, suggest the stock still trades at a discount to what its cash flows imply. That mix of strong historical returns and an intrinsic value estimate that screens as undervalued gives current buyers and long term holders a lot to think about around price and risk.
- Over 5 years, Sterling Infrastructure has returned more than 20x. This puts recent share price moves front and center for anyone thinking about new capital going into the stock.
- Future project wins and execution on existing construction work can support cash generation. Any slowdown in infrastructure spending or weaker bidding discipline may pressure margins and reduce the value of those future cash flows.
- The broader valuation checks form a mixed picture rather than a clear bargain or clear overvaluation, with a value score of 4 out of 6 and both the Discounted Cash Flow (DCF) and earnings multiples pointing to undervaluation.
The issue now is whether Sterling Infrastructure's current share price already reflects that intrinsic value estimate or if the market is still pricing the business too cautiously.
Scan how Sterling Infrastructure compares with other potential deep value opportunities by reviewing 33 high quality undervalued stocks that share a similar mix of strong past returns and discounted cash flow signals.
Is Sterling Infrastructure Still Cheap on Cash Flow?
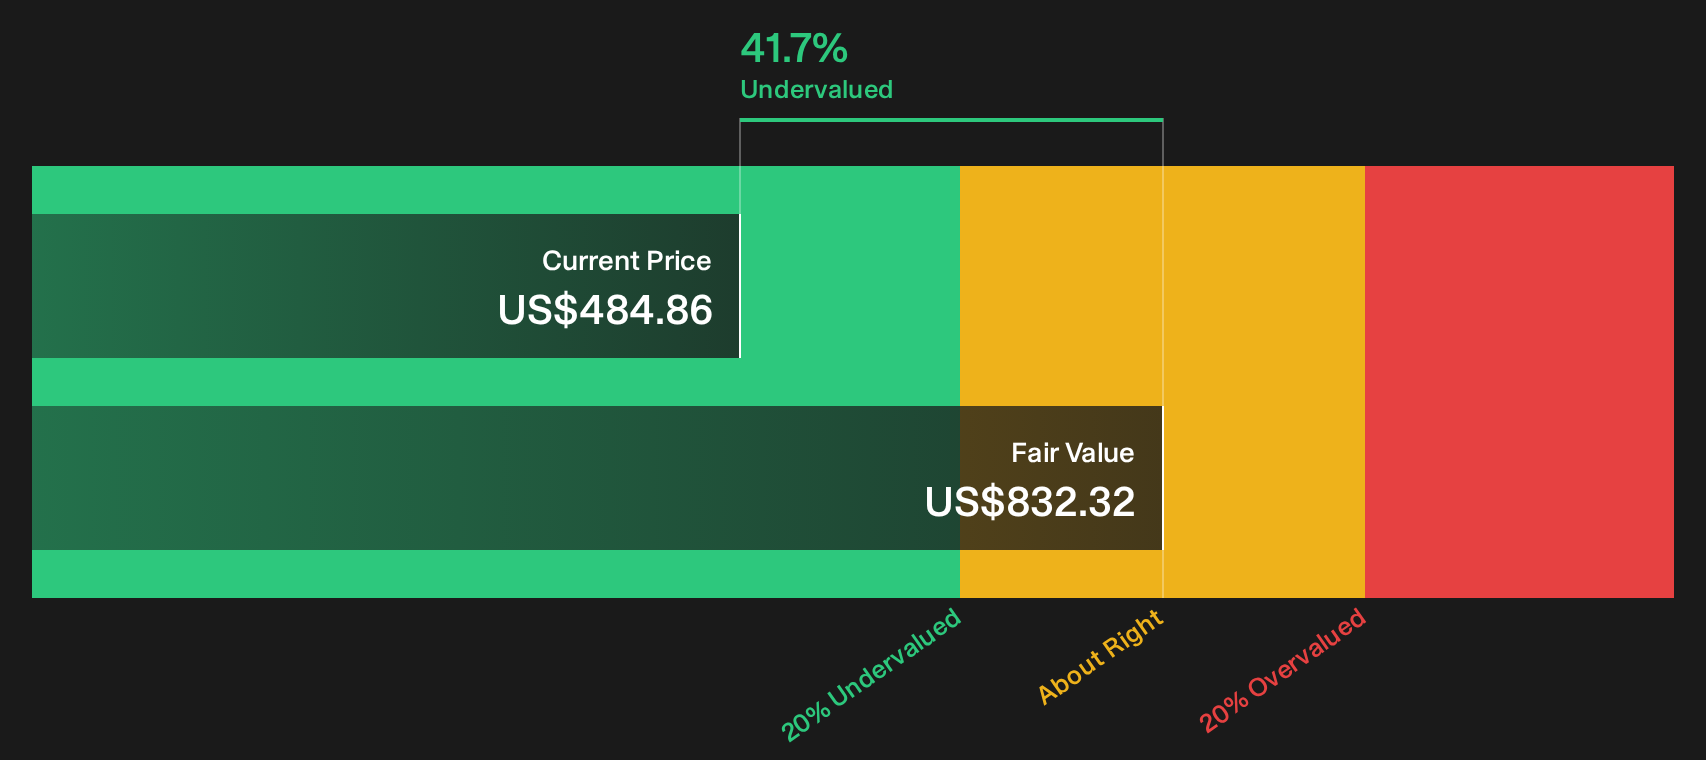
The Discounted Cash Flow model here values Sterling Infrastructure by projecting its future free cash generation and then pulling those cash flows back to today. On the latest twelve month numbers, the business produced about $483.7 million of free cash flow, and the model assumes that figure continues to grow rather than shrink.
Those cash flows, run through a 2 Stage Free Cash Flow to Equity framework, translate into an estimated intrinsic value of about $832 per share. Against the current market price, that implies the stock trades at roughly a 41.7% discount, which points to a wide gap between what the cash flow math suggests and what the market is currently willing to pay for Sterling Infrastructure.
On these assumptions, Sterling Infrastructure appears undervalued relative to the cash flows implied by the Discounted Cash Flow model.
Our Discounted Cash Flow (DCF) analysis suggests Sterling Infrastructure is undervalued by 41.7%. Track this in your watchlist or portfolio, or discover 33 more high quality undervalued stocks.
Is Sterling Infrastructure Still Cheap on Earnings?
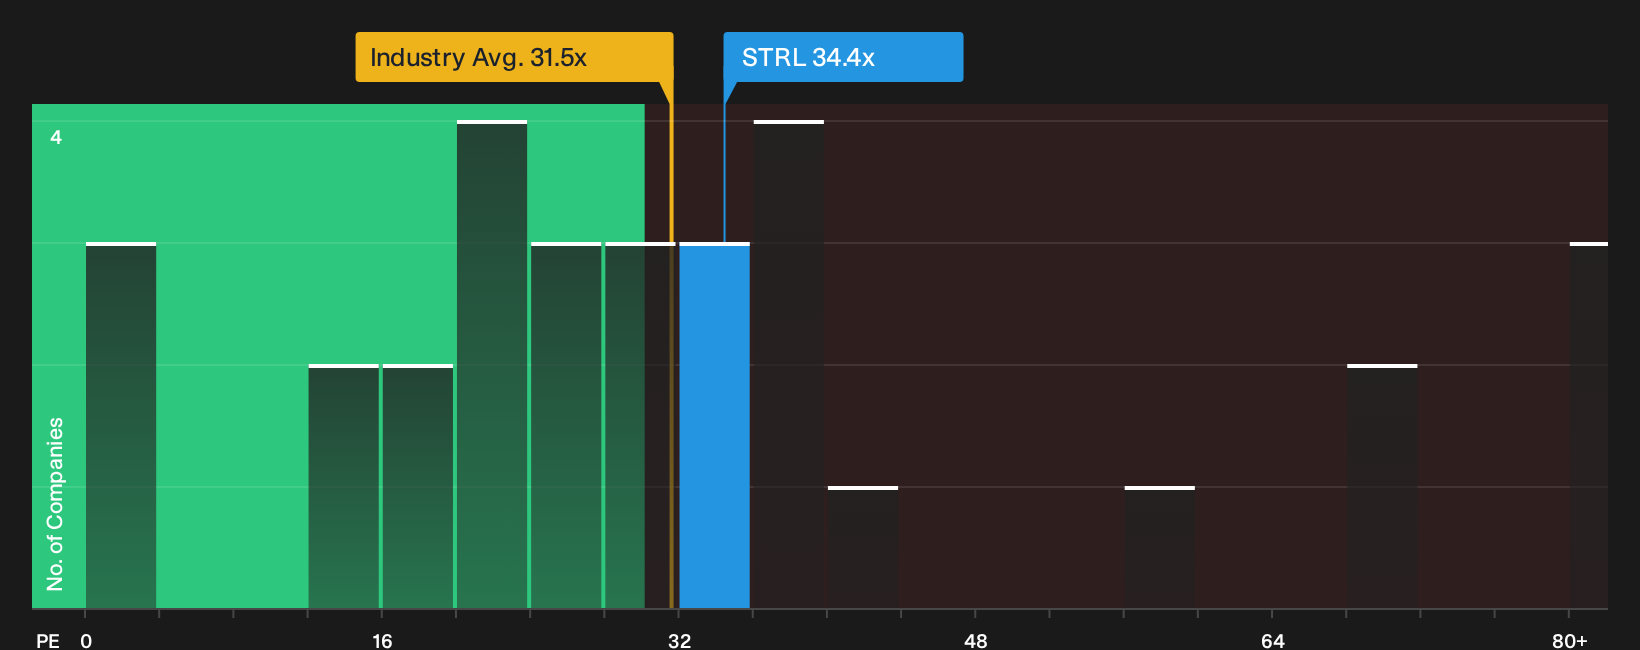
P/E suits Sterling Infrastructure because earnings are the core yardstick investors typically use for construction contractors. On that measure, the stock trades on about 34.4x earnings, which is higher than the construction industry average of roughly 31.5x and above the peer group at about 28.5x. On simple comparisons to rivals, that looks like a premium tag.
The fair P/E ratio from the model sits much higher at about 63.1x. That figure reflects what investors might be willing to pay given the company’s earnings profile, scale and risks. Set against this benchmark, the current 34.4x multiple implies the market is valuing Sterling Infrastructure below that tailored fair level.
On the P/E test, the stock screens as undervalued relative to the fair multiple implied by its earnings profile.
See what the numbers say about this price — find out in our valuation breakdown.
The Sterling Infrastructure Narrative: What Would Justify Today's Price?
Simply Wall St Narratives for Sterling Infrastructure pick up where the discounted cash flow and P/E work leave off by spelling out which combinations of growth, margins and earnings would need to occur for the stock to be worth materially more or materially less than today’s price on the Community page. Each scenario links a fair value estimate to a clear storyline about Sterling Infrastructure's possible catalysts and pressures, so you can track over time which version of events is actually emerging.
One of the top community narratives on Sterling Infrastructure: 45% undervalued
"Current valuation appears to assume continued outsized E-Infrastructure revenue and margin growth, heavily reliant on unprecedented levels of data center construction and mega-project activity…"
Read one of the top narratives on Sterling Infrastructure
Do you think there's more to the story for Sterling Infrastructure? Head over to our Community to see what others are saying!
The Bottom Line
Sterling Infrastructure screens as undervalued on both the Discounted Cash Flow (DCF) view and the tailored P/E multiple, even after a very sharp move in the share price. That mix points to a stock where the debate is less about whether it is cheap on paper and more about whether the cash generation and project discipline can justify those inputs over time. Everything now hinges on how future infrastructure work, data center exposure and bidding quality shape free cash flow and earnings. The key question for any holder is whether the current discount reflects opportunity or fairly prices the risk of weaker project economics ahead.
This article by Simply Wall St is general in nature. We provide commentary based on historical data and analyst forecasts only using an unbiased methodology and our articles are not intended to be financial advice. It does not constitute a recommendation to buy or sell any stock, and does not take account of your objectives, or your financial situation. We aim to bring you long-term focused analysis driven by fundamental data. Note that our analysis may not factor in the latest price-sensitive company announcements or qualitative material. Simply Wall St has no position in any stocks mentioned.
Have feedback on this article? Concerned about the content? Get in touch with us directly. Alternatively, email editorial-team@simplywallst.com