
3 Global Dividend Stocks Yielding Up To 4.7%
As global markets navigate a landscape of rising oil prices, geopolitical tensions, and shifting monetary policy expectations, investors are increasingly focused on strategies that can provide stability amidst volatility. In this environment, dividend stocks stand out as they offer the potential for regular income streams while potentially benefiting from sectors that thrive under current economic conditions.
Top 10 Dividend Stocks Globally
| Name | Dividend Yield | Dividend Rating |
| Yeni Gimat Gayrimenkul Yatirim Ortakligi (IBSE:YGGYO) | 4.69% | ★★★★★★ |
| Telekom Austria (WBAG:TKA) | 4.14% | ★★★★★★ |
| Sakai Moving ServiceLtd (TSE:9039) | 3.97% | ★★★★★★ |
| Nippon Carbon (TSE:5302) | 3.94% | ★★★★★★ |
| NCD (TSE:4783) | 4.60% | ★★★★★★ |
| Kyoritsu Electric (TSE:6874) | 3.85% | ★★★★★★ |
| Kumagai GumiLtd (TSE:1861) | 3.90% | ★★★★★★ |
| Innotech (TSE:9880) | 3.89% | ★★★★★★ |
| Business Brain Showa-Ota (TSE:9658) | 4.45% | ★★★★★★ |
| 104 (TWSE:3130) | 7.05% | ★★★★★★ |
Click here to see the full list of 98 stocks from our Top Global Dividend Stocks screener.
Here's a peek at a few of the choices from the screener.
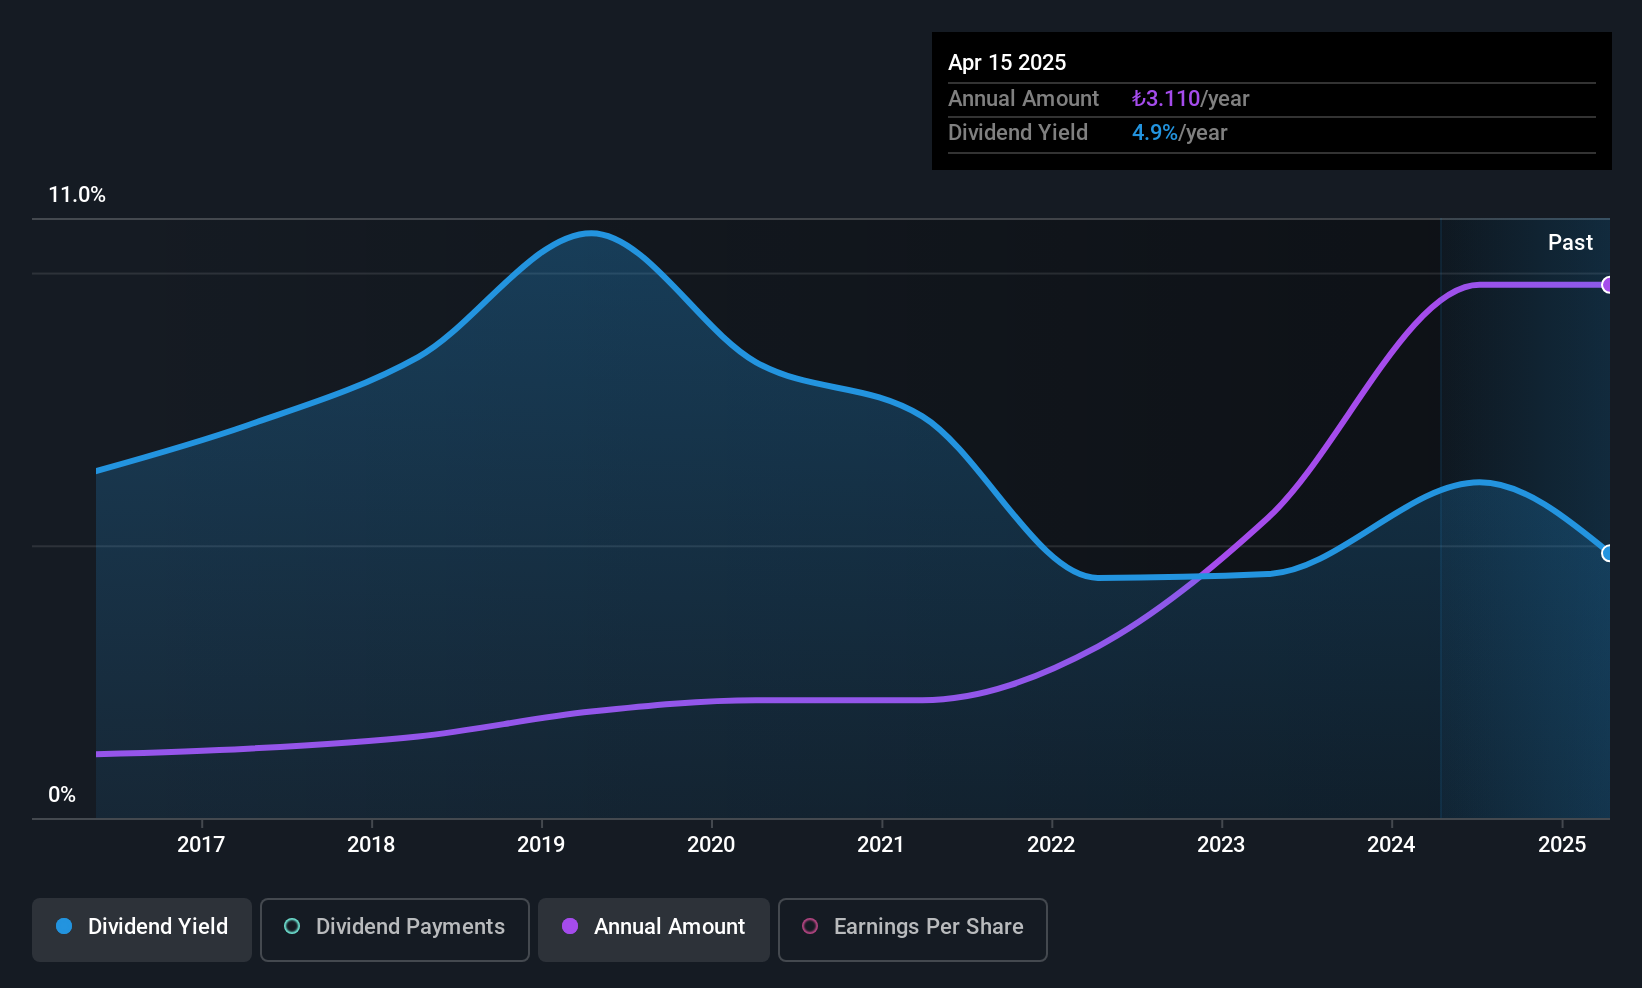
Yeni Gimat Gayrimenkul Yatirim Ortakligi (IBSE:YGGYO)
Simply Wall St Dividend Rating: ★★★★★★
Overview: Yeni Gimat Gayrimenkul Yatirim Ortakligi A.S. operates in the real estate investment sector and has a market capitalization of TRY53.94 billion.
Operations: Yeni Gimat Gayrimenkul Yatirim Ortakligi A.S. does not have detailed revenue segment information available in the provided text.
Dividend Yield: 4.7%
Yeni Gimat Gayrimenkul Yatirim Ortakligi offers a compelling dividend profile with a 4.69% yield, placing it in the top 25% of Turkish market dividend payers. Despite recent fluctuations in sales and net income, the company has maintained stable and growing dividends over the past decade. With a payout ratio of 68.6%, dividends are well-covered by earnings, while cash flow coverage remains adequate at an 82.2% cash payout ratio.
- Delve into the full analysis dividend report here for a deeper understanding of Yeni Gimat Gayrimenkul Yatirim Ortakligi.
- According our valuation report, there's an indication that Yeni Gimat Gayrimenkul Yatirim Ortakligi's share price might be on the expensive side.
Nippon Carbon (TSE:5302)
Simply Wall St Dividend Rating: ★★★★★★
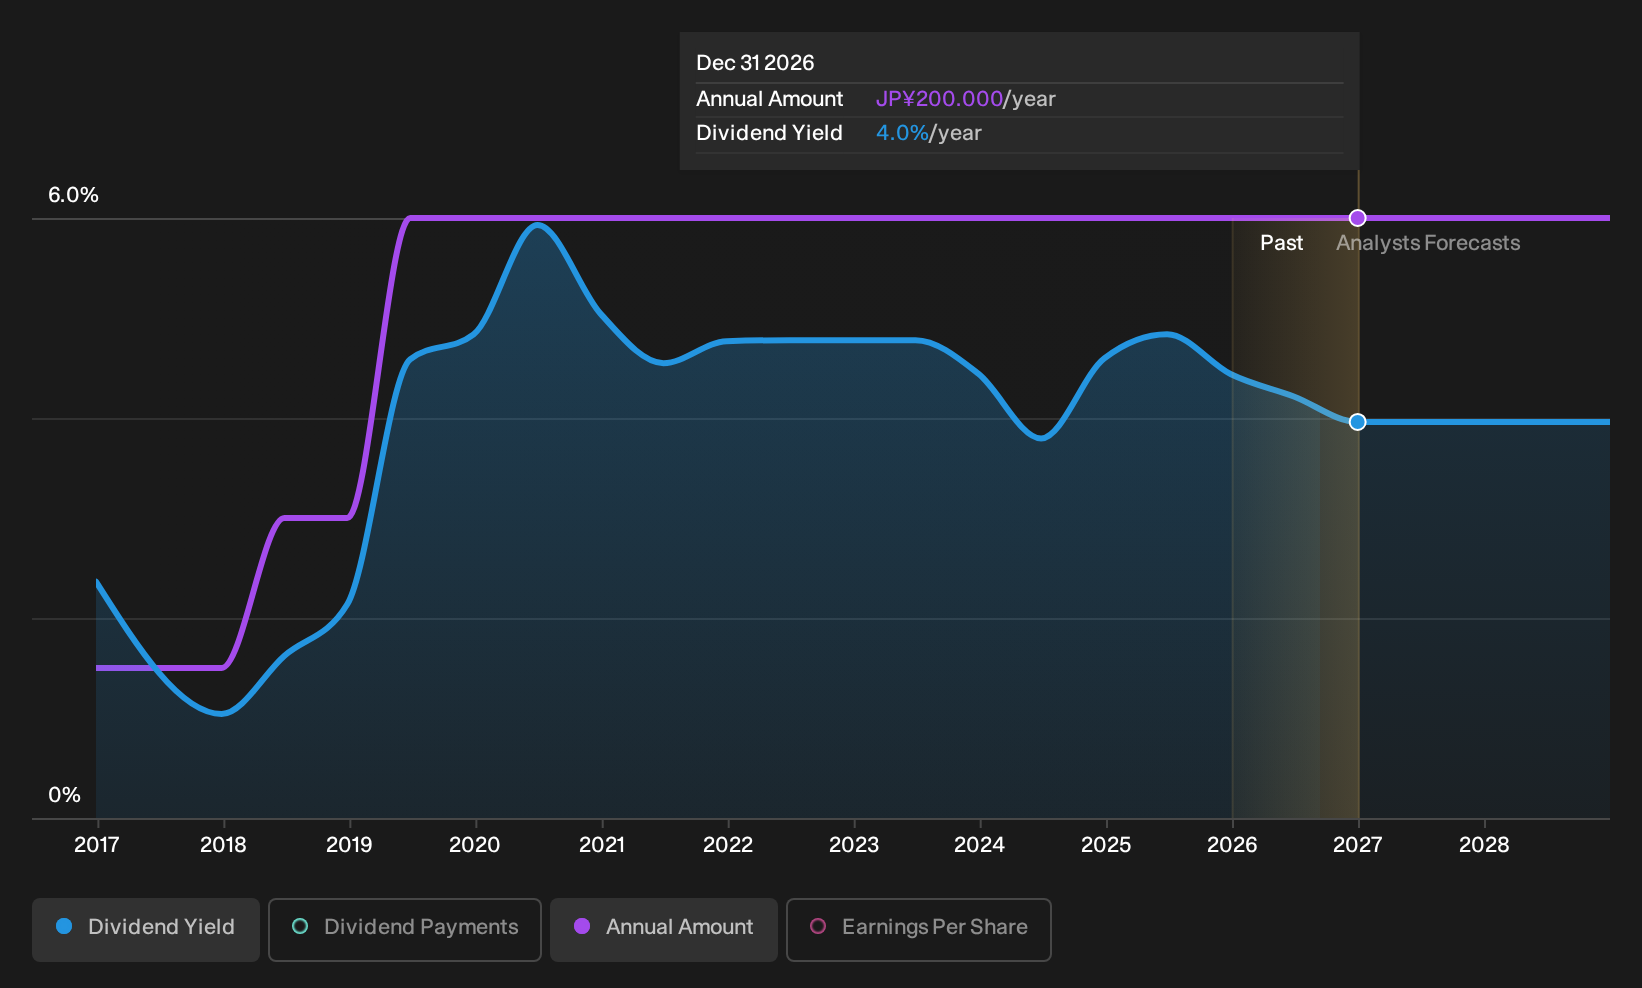
Overview: Nippon Carbon Co., Ltd. is involved in the manufacture and sale of carbon products in Japan, with a market cap of ¥52.89 billion.
Operations: Nippon Carbon Co., Ltd.'s revenue is primarily derived from its Carbon Products Connection segment, which accounts for ¥32.73 billion, and its Carbonized Silicon Product Related segment, contributing ¥4.45 billion.
Dividend Yield: 3.9%
Nippon Carbon maintains a stable dividend profile with a 3.94% yield, ranking in the top 25% of Japanese market payers. Despite a decline in net income to ¥1,365 million for the half-year ended June 30, 2026, dividends remain consistent at ¥100 per share. The payout ratio stands at 56.6%, indicating dividends are well-covered by earnings and cash flows. Recent buybacks totaling ¥2,499.68 million enhance shareholder value alongside reliable dividend payments over the past decade.
- Click to explore a detailed breakdown of our findings in Nippon Carbon's dividend report.
- The valuation report we've compiled suggests that Nippon Carbon's current price could be inflated.
SIGMAXYZ Holdings (TSE:6088)
Simply Wall St Dividend Rating: ★★★★★★
Overview: SIGMAXYZ Holdings Inc., with a market cap of ¥44.76 billion, operates in Japan providing consulting services through its subsidiaries.
Operations: SIGMAXYZ Holdings Inc. generates its revenue primarily from its Consulting Business, which accounted for ¥23.20 billion.
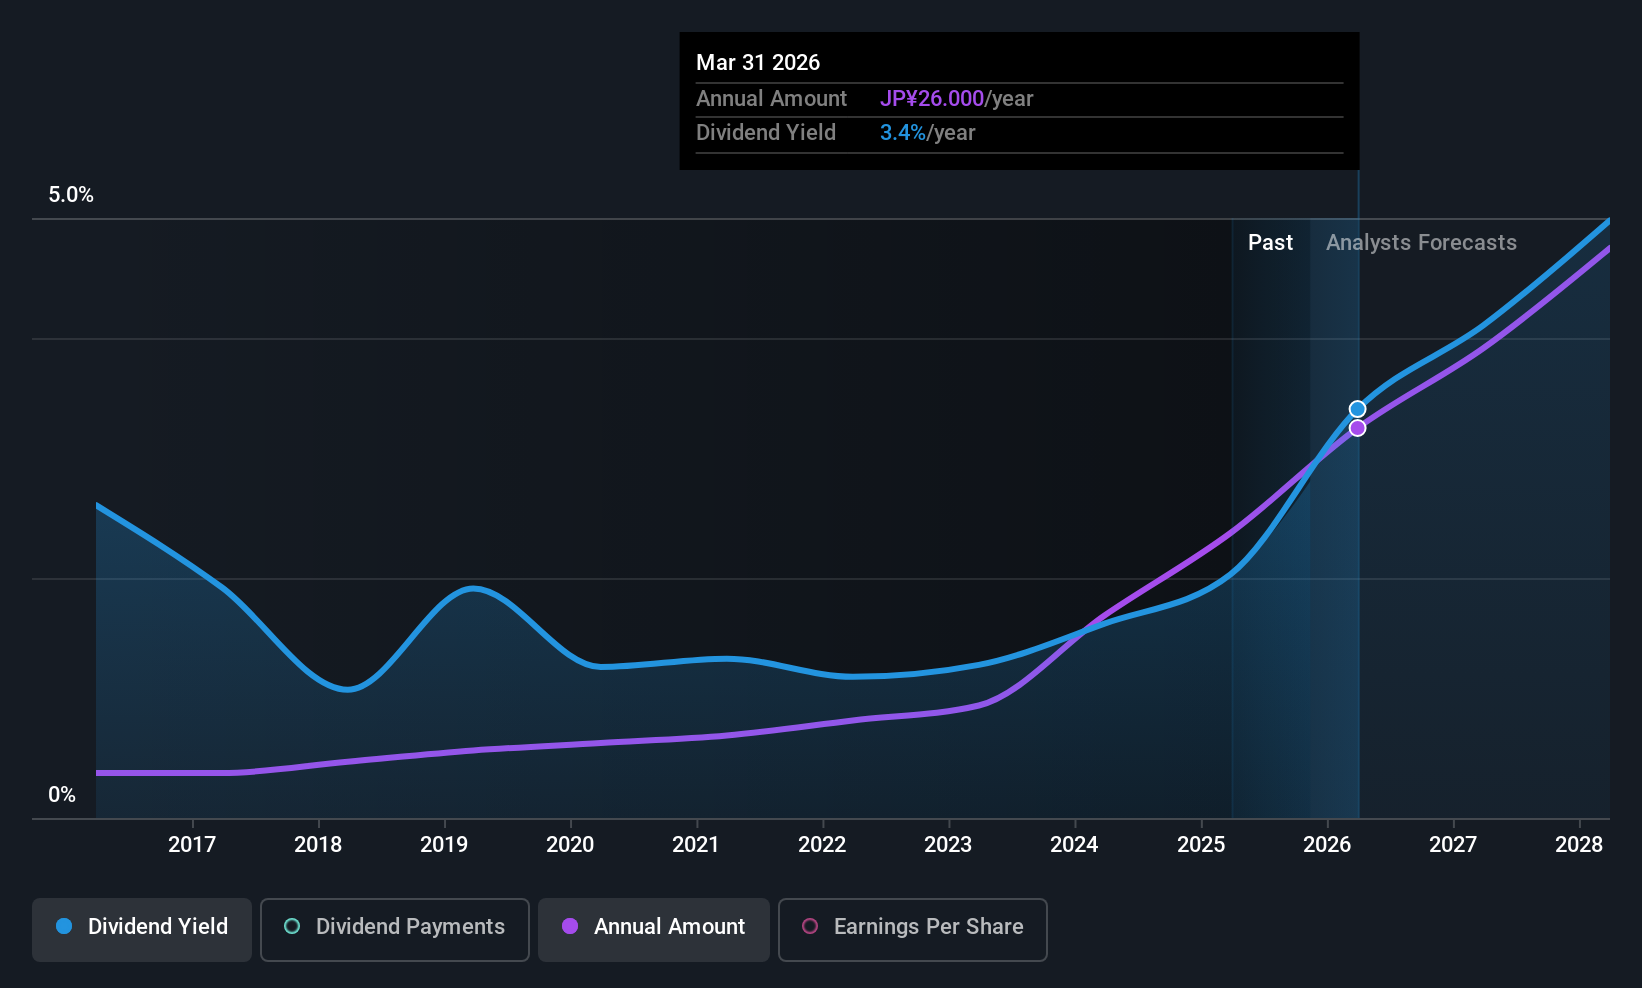
Dividend Yield: 4.7%
SIGMAXYZ Holdings offers a compelling dividend yield of 4.71%, placing it in the top 25% of Japanese dividend payers. The company has maintained stable dividends over the past decade, supported by a payout ratio of 57.5% and cash flow coverage at 74.4%. Despite recent declines in sales and net income, SIGMAXYZ affirmed its year-end dividend guidance at ¥26 per share for fiscal year ending March 31, 2027, consistent with last year's payout.
- Click here to discover the nuances of SIGMAXYZ Holdings with our detailed analytical dividend report.
- In light of our recent valuation report, it seems possible that SIGMAXYZ Holdings is trading behind its estimated value.
Summing It All Up
- Dive into all 98 of the Top Global Dividend Stocks we have identified here.
- Are any of these part of your asset mix? Tap into the analytical power of Simply Wall St's portfolio to get a 360-degree view on how they're shaping up.
- Elevate your portfolio with Simply Wall St, the ultimate app for investors seeking global market coverage.
Want To Explore Some Alternatives?
- Explore high-performing small cap companies that haven't yet garnered significant analyst attention.
- Fuel your portfolio with companies showing strong growth potential, backed by optimistic outlooks both from analysts and management.
- Find companies with promising cash flow potential yet trading below their fair value.
This article by Simply Wall St is general in nature. We provide commentary based on historical data and analyst forecasts only using an unbiased methodology and our articles are not intended to be financial advice. It does not constitute a recommendation to buy or sell any stock, and does not take account of your objectives, or your financial situation. We aim to bring you long-term focused analysis driven by fundamental data. Note that our analysis may not factor in the latest price-sensitive company announcements or qualitative material. Simply Wall St has no position in any stocks mentioned.
Have feedback on this article? Concerned about the content? Get in touch with us directly. Alternatively, email editorial-team@simplywallst.com