
Paramount Skydance (PSKY) Stock Trades Below Fair Value After a 71% Five Year Slump
Paramount Skydance stock is caught between a deep five year share price decline and valuation work that suggests the current market quote may still sit well below its intrinsic value. The Discounted Cash Flow (DCF) estimate and the market multiple checks both point to an undervalued setup, even after a volatile stretch for the shares.
- Over the past five years, Paramount Skydance has fallen about 71%, which signals investors have already priced in a lot of pessimism.
- The key potential support for the valuation is the company’s ability to turn its content assets into steady cash flow, while the main risk is that ongoing investment needs strain those cash flows and delay any payoff for shareholders.
- The broader checks lean cheap, with a high value score of 5 out of 6 pointing to a stock that screens as undervalued on most metrics used here.
The issue now is whether Paramount Skydance’s current price near US$10.38 already reflects the long slide in the share price or if the intrinsic value estimate still points to a meaningful gap.
Scan beyond Paramount Skydance and compare this deep value setup with hand-picked companies on the 33 high quality undervalued stocks list that also screen as potentially cheap on fundamentals.
Does Paramount Skydance Look Undervalued on Cash Flow?
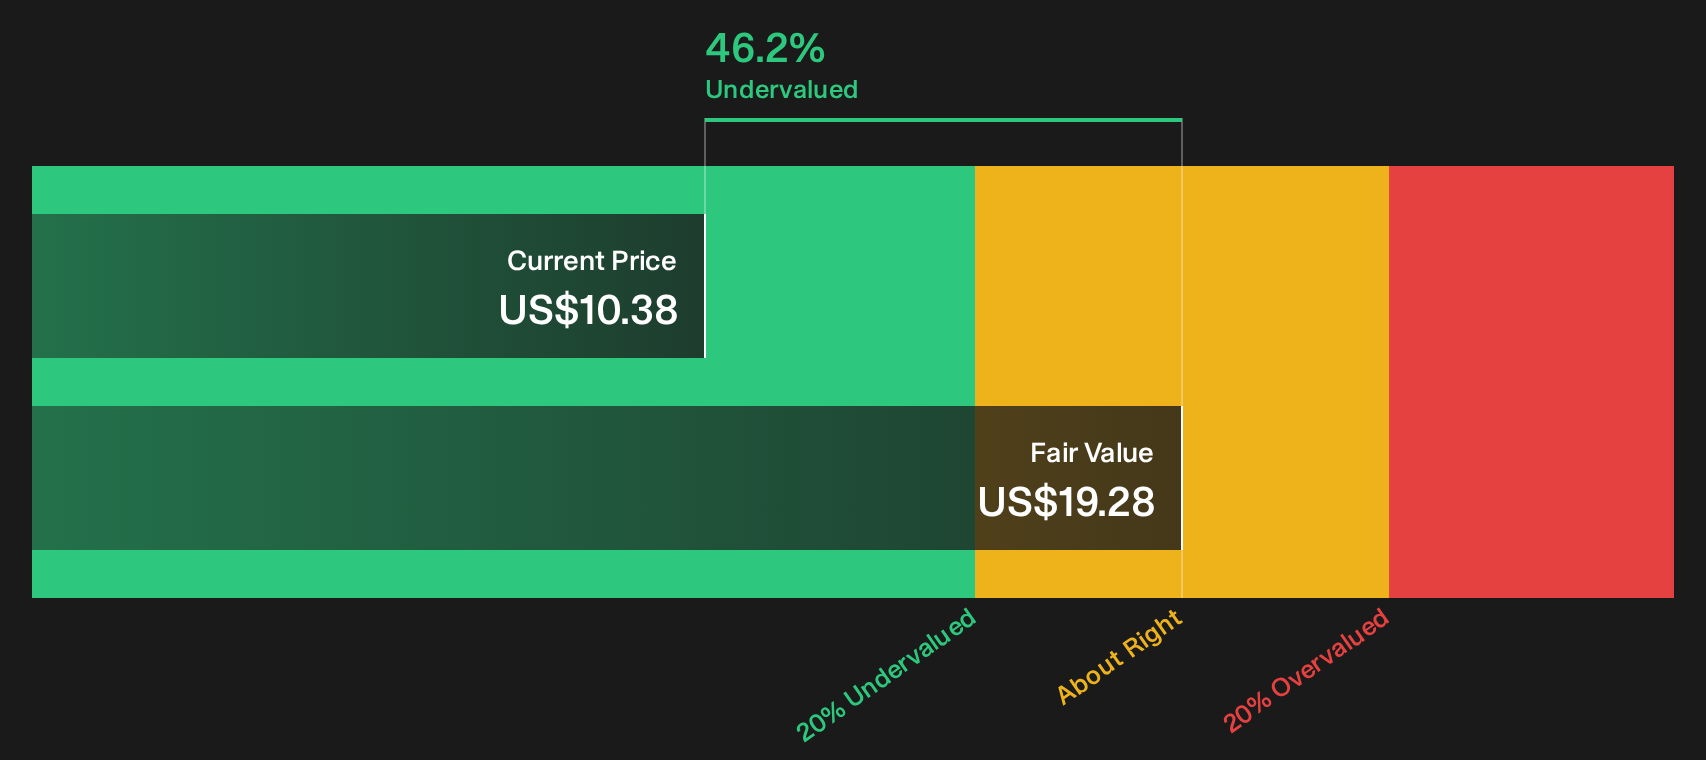
The Discounted Cash Flow (DCF) model here depends on how reliably Paramount Skydance can convert its content library into future free cash generation. The latest twelve month free cash flow sits at about $514.3 million, so the projections assume a business that is growing from that base rather than shrinking. On those forecasts, the model points to an estimated intrinsic value of about $19.28 per share.
Set that against the recent share price around $10.38, and the DCF implies the stock trades at roughly a 46.2% discount to those cash flow estimates. For readers, that gap suggests the market is pricing in substantial execution risk around Paramount Skydance’s ability to sustain and scale its free cash flow, while the model assumes those cash streams hold up.
On these cash flow projections, Paramount Skydance stock appears undervalued relative to the current share price.
Our Discounted Cash Flow (DCF) analysis suggests Paramount Skydance is undervalued by 46.2%. Track this in your watchlist or portfolio, or discover 33 more high quality undervalued stocks.
Does Paramount Skydance Look Undervalued on Sales?
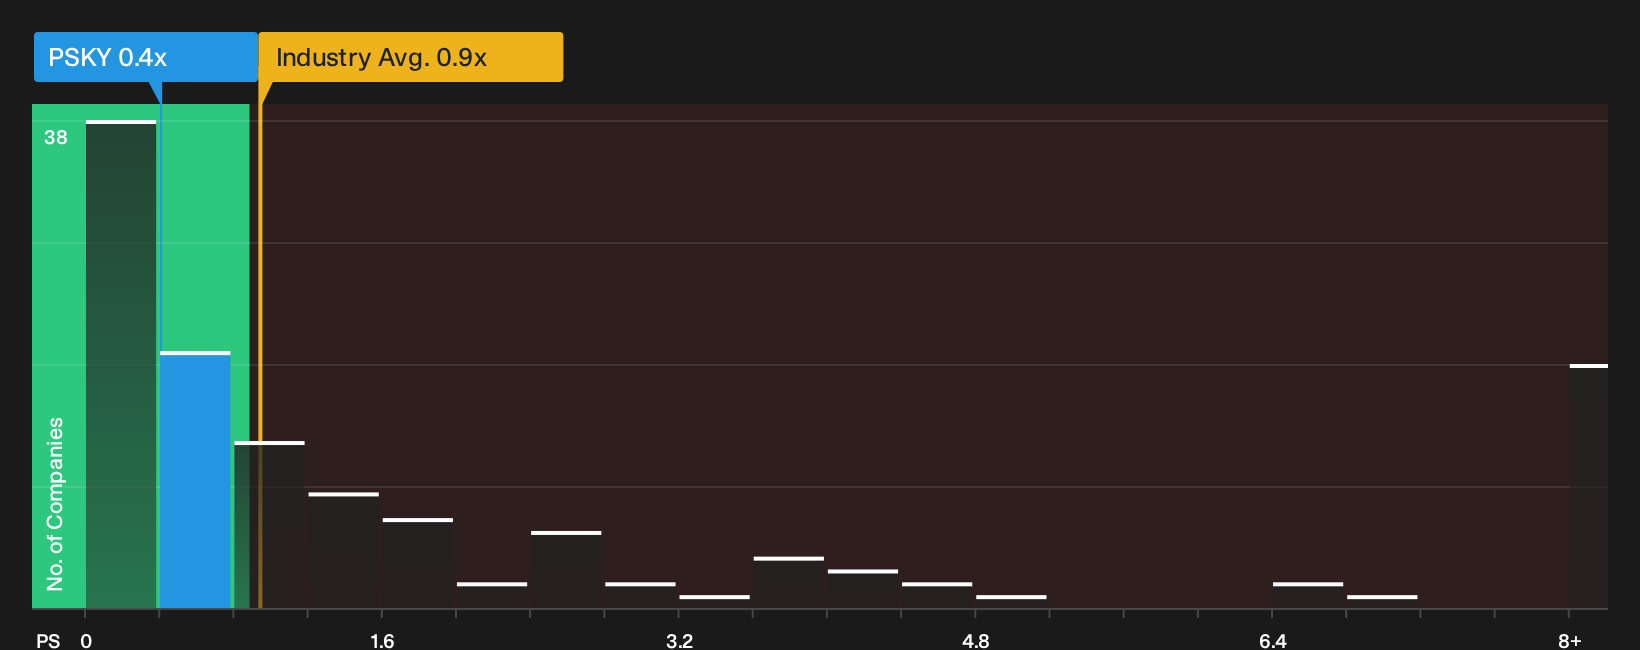
P/S is a useful lens for Paramount Skydance because investors often anchor media valuations to revenue rather than reported earnings. On that basis, the stock trades at about 0.4x P/S, which is well below both the media industry average of roughly 0.9x and a higher peer group average near 2.4x. The gap shows the market is assigning a relatively low value to each dollar of Paramount Skydance’s sales compared with similar businesses.
The Fair Ratio model, which blends factors such as size, margins and risk, points to a P/S closer to 1.3x as a more typical level for the company. That is more than triple the recent 0.4x reading. The spread between the current valuation and this tailored benchmark indicates investors are pricing in significant caution around future revenue quality and durability.
On the P/S multiple, Paramount Skydance stock currently appears undervalued relative to both its industry yardsticks and the Fair Ratio estimate.
See what the numbers say about this price — find out in our valuation breakdown.
The Paramount Skydance Narrative: What Would Justify Today's Price?
Simply Wall St Narratives for Paramount Skydance pick up where this valuation puzzle leaves off by spelling out which paths for growth, profitability and earnings would need to play out for the shares to be worth materially more or materially less than today’s price. They live on Simply Wall St’s Community page. Each scenario links its number to a clear view on how Paramount Skydance's growth, margins and risk profile could evolve, which you can revisit as fresh information comes through.
Community views on Paramount Skydance are split between one group that sees a meaningful valuation gap and another that thinks expectations already run hot.
Bull case: 35% undervalued
"The convergence of multiple streaming services onto a single unified technology platform, combined with Oracle Fusion and advanced AI tools for discovery and ad tech, is set to improve product quality and operating discipline..."
Read the full Bull Case to see why Paramount Skydance could be undervalued
Bear case: 6% overvalued
"Some cautious voices argue that deal machinations now dominate the Paramount Skydance story and add execution risk to both the merger and the standalone plan..."
Read the full Bear Case to see why Paramount Skydance could be overvalued
Do you think there's more to the story for Paramount Skydance? Head over to our Community to see what others are saying!
The Bottom Line
Paramount Skydance screens as undervalued on both Discounted Cash Flow (DCF) and sales based checks, which points to a clear valuation cushion rather than a tight finish. The gap only really closes if you think cash generation from the content library stays under strain and the market never pays more for each dollar of revenue. Everything now turns on that free cash flow trajectory and whether management can fund ongoing investment without eroding returns. The key question for you is whether the current discount reflects mispricing or a fair penalty for execution risk around the streaming and content strategy.
This article by Simply Wall St is general in nature. We provide commentary based on historical data and analyst forecasts only using an unbiased methodology and our articles are not intended to be financial advice. It does not constitute a recommendation to buy or sell any stock, and does not take account of your objectives, or your financial situation. We aim to bring you long-term focused analysis driven by fundamental data. Note that our analysis may not factor in the latest price-sensitive company announcements or qualitative material. Simply Wall St has no position in any stocks mentioned.
Have feedback on this article? Concerned about the content? Get in touch with us directly. Alternatively, email editorial-team@simplywallst.com