
Millrose Properties (MRP) Stock Still Looks Cheap Following A 7% Weekly Slide
Millrose Properties enters this week under pressure, with the share price easing over recent sessions while the broader valuation checks still lean cheap on most measures. For investors, the puzzle is whether that combination points to a genuine bargain or simply reflects the risks already building into the stock.
- The share price declined 6.7% over the past week, which suggests sentiment toward Millrose Properties has softened in the very near term.
- Future cash flow from its real estate portfolio can support the current market value, but concentrated exposure to property cycles may weigh on how much investors are willing to pay for the equity.
- The company screens as attractively priced on several metrics, with the broader checks indicating Millrose Properties looks cheap in most of the six valuation tests.
The issue now is whether Millrose Properties is genuinely mispriced or simply reflecting the risks that come with its current business profile and recent share performance.
Scan beyond Millrose Properties and size up other potential value candidates using the 33 high quality undervalued stocks that filter for strong fundamentals and compressed valuations.
Is Millrose Properties Still Cheap on Earnings?
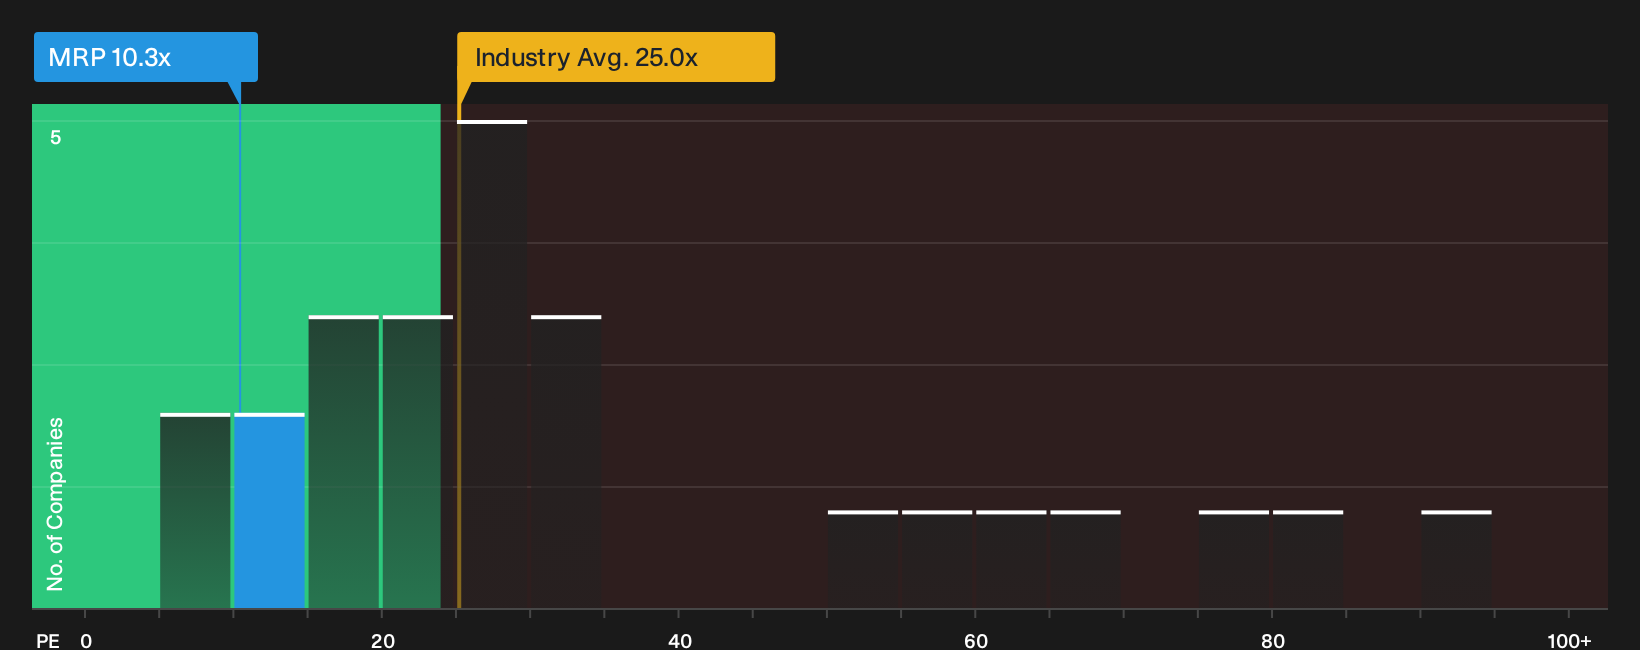
The P/E ratio suits Millrose Properties because earnings are a direct output of how effectively its real estate portfolio is being run for shareholders. On this metric, the stock trades at about 10.3x earnings, which sits well below the Specialized REITs industry average of roughly 17.2x and the broader peer group on about 18.6x. For a property player with this profile, that is a wide gap in what investors are currently willing to pay for each dollar of profit.
A more tailored yardstick, the modelled fair P/E ratio of 35.3x, suggests an even larger disconnect between Millrose Properties and what similar earnings streams might command given sector, scale and risk inputs. The current multiple is far under that reference point, which indicates the market is pricing in a heavy margin of caution around the stock despite those earnings.
On the P/E test, Millrose Properties appears inexpensive relative to sector norms and its own modelled fair multiple.
See what the numbers say about this price — find out in our valuation breakdown.
The Millrose Properties Narrative: What Would Justify Today's Price?
Simply Wall St Narratives pick up where the Millrose Properties valuation gap leaves off by spelling out which assumptions on growth, profitability and earnings would need to hold for the stock to be worth significantly more or less than the current price. They sit on the platform's Community page. Each one treats fair value as a specific, testable view on Millrose Properties' business over time, rather than a single static number.
Use the Narratives tool to put your own number driven case on Millrose Properties' valuation, growth, margins and execution into the Simply Wall St community and see how it stacks up as fresh data lands.
If you already have a thesis on where Millrose Properties' fundamentals could head next, share it as a Narrative and track how the argument holds up over time.
Do you think there's more to the story for Millrose Properties? Head over to our Community to see what others are saying!
The Bottom Line
Millrose Properties screens as undervalued on market multiples, with the P/E gap to peers suggesting that investors are pricing in a sizable caution discount. Broader valuation checks still appear supportive. The key question is whether that markdown reflects genuine mispricing or simply incorporates the concentrated exposure to property cycles. What matters from here is whether the real estate portfolio can keep delivering earnings that justify a rerating of the multiple, rather than the current price merely serving as compensation for the underlying risk.
This article by Simply Wall St is general in nature. We provide commentary based on historical data and analyst forecasts only using an unbiased methodology and our articles are not intended to be financial advice. It does not constitute a recommendation to buy or sell any stock, and does not take account of your objectives, or your financial situation. We aim to bring you long-term focused analysis driven by fundamental data. Note that our analysis may not factor in the latest price-sensitive company announcements or qualitative material. Simply Wall St has no position in any stocks mentioned.
Have feedback on this article? Concerned about the content? Get in touch with us directly. Alternatively, email editorial-team@simplywallst.com