
CorVel (CRVL) Rebounds To A Premium, Is The Stock Fully Priced?
CorVel (CRVL) has drawn fresh attention after recent trading left the shares pricing in a slight intrinsic premium to its estimated value, based on current models. That disconnect raises clear questions for valuation focused investors.
Recent trading has been choppy for CorVel. The share price return is up 10.6% over the past month and 12.2% over 90 days, yet the 1 year total shareholder return has fallen 23.3%. This suggests fading longer term momentum even as shorter term sentiment improves around the current premium valuation.
Scan beyond CorVel's recent premium and look at other health related businesses where price and fundamentals appear better aligned by running the list of solid balance sheet and fundamentals (23 results).
CorVel now trades at a small premium to current fair value estimates after a sharp near term rebound and a weaker 1 year result. Does that pricing still offer enough upside to justify the risk from here?
Price-to-Earnings of 29.6x: Is it justified?
On simple valuation math, CorVel trades on a P/E of 29.6x, which leaves the stock looking expensive compared with the broader US Healthcare sector average of 25x.
The P/E ratio compares the current share price with earnings per share, so a higher multiple usually signals that investors are willing to pay more today for each dollar of profit. For a healthcare services and technology provider like CorVel, that kind of premium typically reflects confidence in the durability of earnings and the quality of those profits.
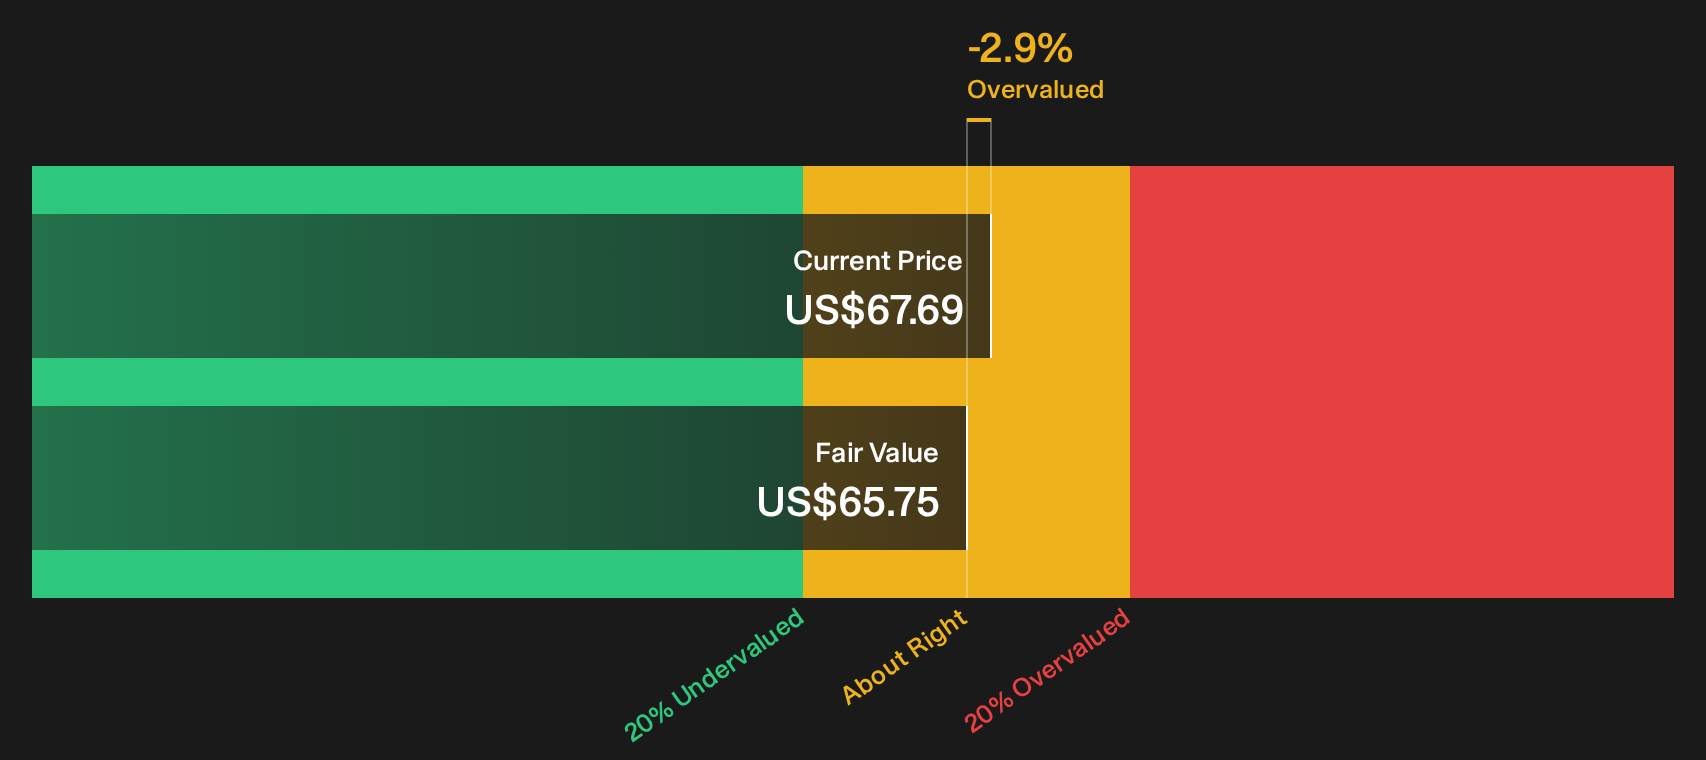
With earnings growing 14.2% per year over the past 5 years and Return on Equity at 28.2%, the valuation suggests investors are paying up for a track record of high quality profit and solid capital efficiency. The small premium to the SWS DCF model estimate of $65.75 also points to the market already pricing in some of that strength, rather than leaving a wide margin for positive surprises.
The comparison with peers is more nuanced. The same 29.6x P/E looks expensive against the wider US Healthcare industry at 25x, yet it screens as good value against a tighter peer group on 40.6x, where similar businesses change hands at materially higher earnings multiples.
See what the numbers say about this price — find out in our valuation breakdown.
Result: Price-to-Earnings of 29.6x (ABOUT RIGHT).
Still, CorVel's 23.3% 1 year total return decline and its concentration in US workers’ compensation and managed care leave the story exposed to sector specific and regulatory shocks.
Find out about the key risks to this CorVel narrative.
Another view on CorVel’s value
Look past the earnings multiple and the SWS DCF model offers a quieter message. With our DCF estimate at $65.75 versus a share price of $67.69, CorVel screens as slightly overvalued on future cash flows. Does that small gap signal limited upside, or is it simply a normal pricing cushion?
Look into how the SWS DCF model arrives at its fair value.
Simply Wall St performs a discounted cash flow (DCF) on every stock in the world every day (check out CorVel for example). We show the entire calculation in full. You can track the result in your watchlist or portfolio and be alerted when this changes, or use our stock screener to discover 33 high quality undervalued stocks. If you save a screener we even alert you when new companies match - so you never miss a potential opportunity.
Next Steps
Sentiment around CorVel is mixed, with both clear concerns and genuine bright spots on show. Move quickly, review the underlying data, and weigh the 1 key reward and 1 important warning sign.
Looking for more investment ideas beyond CorVel?
If CorVel's current pricing leaves you on the fence, consider broadening your watchlist and stress test your thesis against other opportunities that line up more closely with your priorities.
- Target resilience first by scanning companies with stronger balance sheets and fundamentals through the list of solid balance sheet and fundamentals (23 results).
- Hunt for potential mispricings by reviewing the 33 high quality undervalued stocks that pair healthier cash flows with more grounded valuations.
- Build a steadier income stream by checking out the 6 dividend fortresses that combine higher yields with a focus on durability.
This article by Simply Wall St is general in nature. We provide commentary based on historical data and analyst forecasts only using an unbiased methodology and our articles are not intended to be financial advice. It does not constitute a recommendation to buy or sell any stock, and does not take account of your objectives, or your financial situation. We aim to bring you long-term focused analysis driven by fundamental data. Note that our analysis may not factor in the latest price-sensitive company announcements or qualitative material. Simply Wall St has no position in any stocks mentioned.
Have feedback on this article? Concerned about the content? Get in touch with us directly. Alternatively, email editorial-team@simplywallst.com