
Enterprise Products Partners (EPD) Stock Looks Reasonable On A 152% Five Year Run
Enterprise Products Partners has quietly turned a long, strong run in the unit price into a valuation puzzle, with a powerful five year return set against a mixed overall value score and a market multiple that still screens as undervalued. For income focused investors eyeing the partnership today, the key question is whether that combination signals remaining upside or simply reflects the risk profile and cash flow profile already on display.
- Over the past 5 years, Enterprise Products Partners has returned about 152.0%, which points to a long period where unitholders have been well rewarded.
- Future valuation can be shaped by how consistently the partnership converts its midstream assets into steady cash flows. At the same time, any shift in perceived volume or regulatory risk may cap how much investors are willing to pay for that stability.
- The stock screens as undervalued on market multiples, yet a value score of 4 out of 6 still leaves a mixed picture rather than a clear bargain or clear overvaluation.
The stock's next move may depend on whether that five year track record and current multiple leave enough room for investors to be compensated for the risks they are taking with Enterprise Products Partners.
Scan beyond Enterprise Products Partners and evaluate other income focused plays with strong financial foundations using our solid balance sheet and fundamentals stocks screener (23 results).
Does Enterprise Products Partners Look Undervalued on Earnings?
The P/E ratio fits Enterprise Products Partners because earnings stability matters a lot for a midstream partnership built around long term contracts and fee based cash flows.
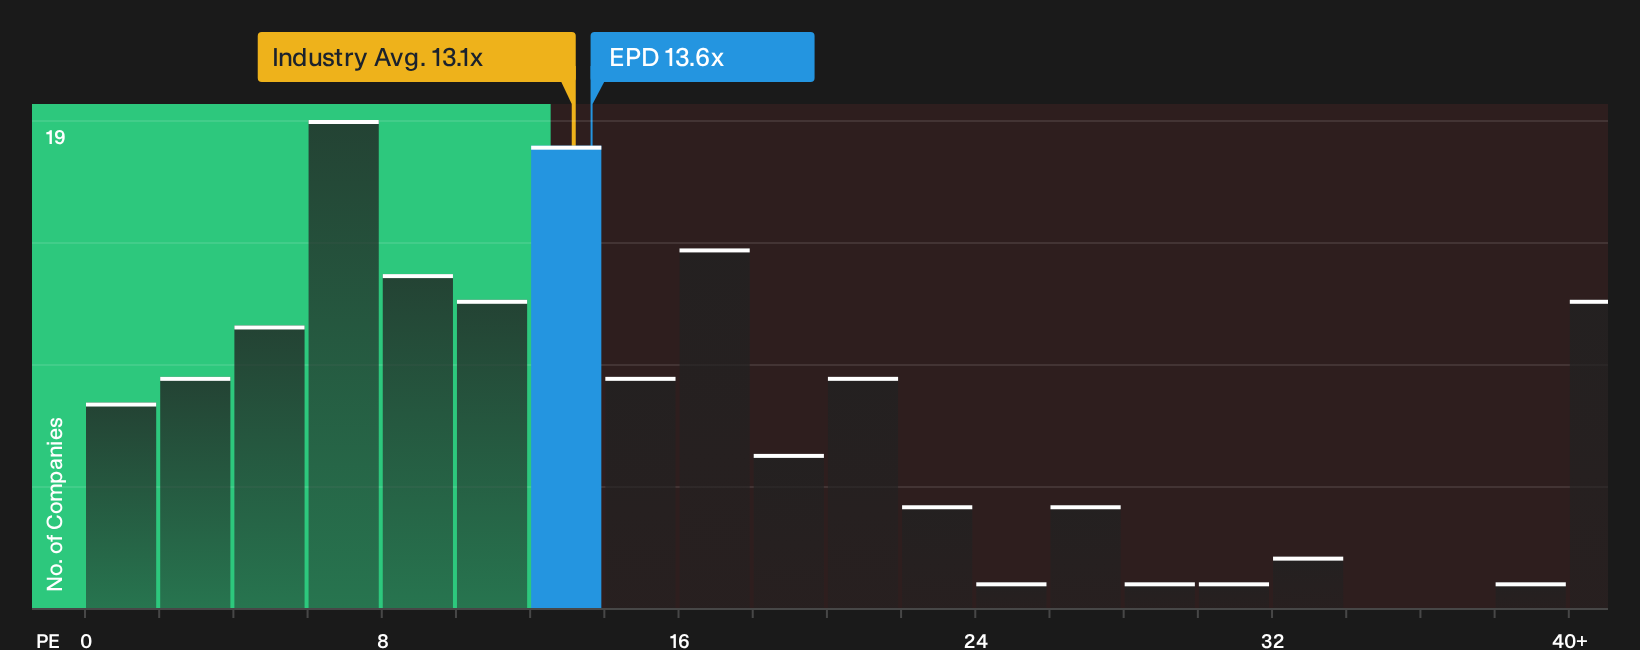
On this metric, Enterprise Products Partners trades at about 13.5x earnings, which is very close to the Oil and Gas industry average of roughly 13.0x. Against that broad sector yardstick, the stock does not look stretched. Compared with a peer group average of about 22.8x, the partnership changes hands at a much lower earnings multiple.
The tailored fair P/E ratio for Enterprise Products Partners is estimated at about 23.6x, which is higher than the current 13.5x level. That gap indicates the market prices the partnership below what this framework implies for its risk profile and earnings power.
On the P/E measure, Enterprise Products Partners appears undervalued relative to both peers and its modelled fair multiple.
See what the numbers say about this price — find out in our valuation breakdown.
The Enterprise Products Partners Narrative: What Would Justify Today's Price?
Simply Wall St Narratives for Enterprise Products Partners sit on the Community page and extend this valuation puzzle into a set of clear, forward looking stories about what would need to happen to growth, margins and earnings for the units to be worth meaningfully more or less than today. Where a single ratio or model outputs one figure, these break that number into the future conditions it relies on so you can watch whether those assumptions actually play out over time.
Add your own narrative on Enterprise Products Partners' units, present a number-driven case for where its growth, margins and execution may go from here, and then compare that thesis with future results.
Do you think there's more to the story for Enterprise Products Partners? Head over to our Community to see what others are saying!
The Bottom Line
Enterprise Products Partners screens as undervalued on its current earnings multiple, which points to a market that is still discounting its cash flow stability and risk profile. The mixed value score tempers that signal and suggests broader checks are not uniformly supportive of a deep discount story. The key question from here is whether investors continue to treat the partnership’s cash flows and risk exposure as worthy of a higher multiple, or whether today’s pricing already reflects the right trade off between income, regulatory risk and volume uncertainty.
This article by Simply Wall St is general in nature. We provide commentary based on historical data and analyst forecasts only using an unbiased methodology and our articles are not intended to be financial advice. It does not constitute a recommendation to buy or sell any stock, and does not take account of your objectives, or your financial situation. We aim to bring you long-term focused analysis driven by fundamental data. Note that our analysis may not factor in the latest price-sensitive company announcements or qualitative material. Simply Wall St has no position in any stocks mentioned.
Have feedback on this article? Concerned about the content? Get in touch with us directly. Alternatively, email editorial-team@simplywallst.com