
Equital (TASE:EQTL) Moved After Its Latest Update, What Is The Market Seeing?
Equital earnings event puts mixed trends in focus
Equital (TASE:EQTL) has just reported second quarter and first half 2026 results, with quarterly net income and sales higher than a year ago while six month revenue and profit moved lower.
Despite the mixed half year results, Equital’s share price has risen 6.04% over the past month but remains under pressure, with a year to date share price return down 32.4% and a 1 year total shareholder return down 23.51%. This suggests that recent momentum is building from a weaker base as investors reassess both earnings resilience and risk.
Compare Equital’s mixed earnings reaction with other stocks that screen for resilient fundamentals using our curated list of solid balance sheet and fundamentals (193 results)
Equital’s share price has bounced, yet its quoted value still reflects deep scepticism relative to the range of fair value estimates implied by its earnings profile. How far apart are price and fundamentals right now?
Price-to-earnings of 6.9x for Equital: Is it justified?
Equital screens as inexpensive on earnings, with the stock trading on a P/E of 6.9x while the SWS DCF model points to a fair value of roughly ₪318.82 against a last close of ₪110.6. That gap suggests the market is attaching a heavy discount to the business relative to what its recent profit profile and cash flow estimates imply.
The P/E ratio compares the current share price to earnings per share and gives a quick sense of how much investors are paying for each unit of profit. For a group like Equital, which operates across oil and gas, property leasing and construction, this measure helps you see how the market values its diverse income streams in one number.
Context matters. The past year shows earnings growth of 25.7% for Equital after several years where profit had been moving lower on average, and net profit margins have stepped up from 12.4% to 17.9%. At the same time, a large one off gain of ₪490.1m has boosted reported results, and debt is not well covered by operating cash flow. As a result, part of the low P/E and large DCF discount likely reflects investor caution around the quality and sustainability of those profits rather than a simple mispricing.
Peer comparison is where the valuation gap becomes clearer. Equital trades on a P/E of 6.9x, which the data flags as good value versus both the Asian oil and gas industry average of 12.2x and a peer group average of 14.2x. That is a deep earnings discount compared to sector and peer benchmarks, and it leaves more room for investor perception to shift if the underlying cash generation and one off effects become better understood.
See what the numbers say about this price — find out in our valuation breakdown.
Result: Price-to-earnings of 6.9x (UNDERVALUED)
Still, Equital’s reliance on a large one off gain and debt that is not well covered by operating cash flow could keep that valuation gap in place.
Find out about the key risks to this Equital narrative.
Another view on Equital’s valuation
One check on the low P/E is the fair value result from the SWS DCF model, which comes in at ₪318.82 per share versus a market price of ₪110.6. On that measure Equital screens as heavily undervalued, so the question is whether cash flows or market caution are telling the truer story.
Look into how the SWS DCF model arrives at its fair value.
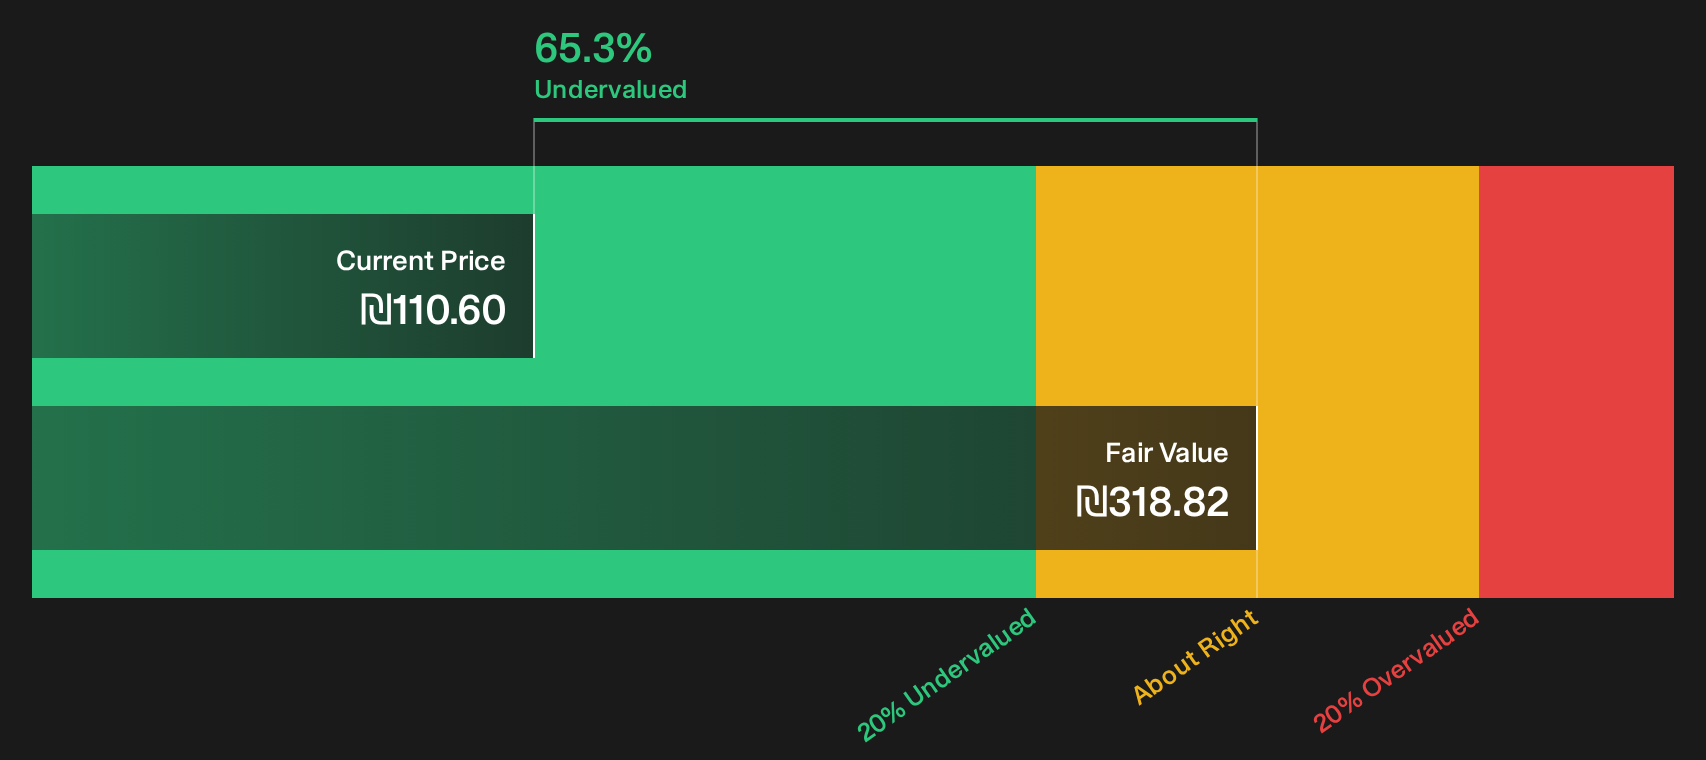
Simply Wall St performs a discounted cash flow (DCF) on every stock in the world every day (check out Equital for example). We show the entire calculation in full. You can track the result in your watchlist or portfolio and be alerted when this changes, or use our stock screener to discover 183 high quality undervalued stocks. If you save a screener we even alert you when new companies match - so you never miss a potential opportunity.
Next Steps
Mixed signals from Equital’s latest figures can pull sentiment in both directions, so move quickly, look through the data yourself, then weigh the 2 key rewards and 3 important warning signs.
Looking for more Equital sized opportunities?
If Equital has your attention, do not stop at one idea. Use the same disciplined approach to scan a broader watchlist and pressure test your next moves.
- Target resilient balance sheets and steady fundamentals with our curated list of solid balance sheet and fundamentals (193 results) to see which businesses pass stricter financial health checks.
- Hunt for potential value gaps by comparing market prices against fundamentals using the focused 183 high quality undervalued stocks that filters for stronger quality characteristics.
- Build a cash flow oriented watchlist by reviewing companies in the 164 dividend fortresses that pair higher yields with an emphasis on resilience.
This article by Simply Wall St is general in nature. We provide commentary based on historical data and analyst forecasts only using an unbiased methodology and our articles are not intended to be financial advice. It does not constitute a recommendation to buy or sell any stock, and does not take account of your objectives, or your financial situation. We aim to bring you long-term focused analysis driven by fundamental data. Note that our analysis may not factor in the latest price-sensitive company announcements or qualitative material. Simply Wall St has no position in any stocks mentioned.
Have feedback on this article? Concerned about the content? Get in touch with us directly. Alternatively, email editorial-team@simplywallst.com