
Realty Income (O) Stock Looks Fully Valued Despite A Big Cash Flow Gap
Realty Income presents an unusual valuation split right now, with its Discounted Cash Flow (DCF) intrinsic value estimate pointing to a large gap to the upside, while traditional market multiples suggest the stock is not cheap and the broader value score reads as weak.
- Over the past 3 years, Realty Income has returned about 29.9%, which suggests the long term income story has still been rewarded even through recent share price softness.
- The 5.3% dividend yield and long record of monthly dividend increases can support the investment case, while any pressure on key retail and gaming tenants remains a risk for future cash flows.
- The broader valuation checks are cautious, with a value score of 2 out of 6, which points to Realty Income looking expensive on several measures rather than like a straightforward bargain.
For investors, the debate is whether the DCF style intrinsic value signal or the richer market multiples provide the better guide to where Realty Income should trade from here.
Compare Realty Income's income profile with hand-picked high yield candidates in the 6 dividend fortresses to see how other potential dividend sources stack up.
Is Realty Income a Bargain on Cash Flow?
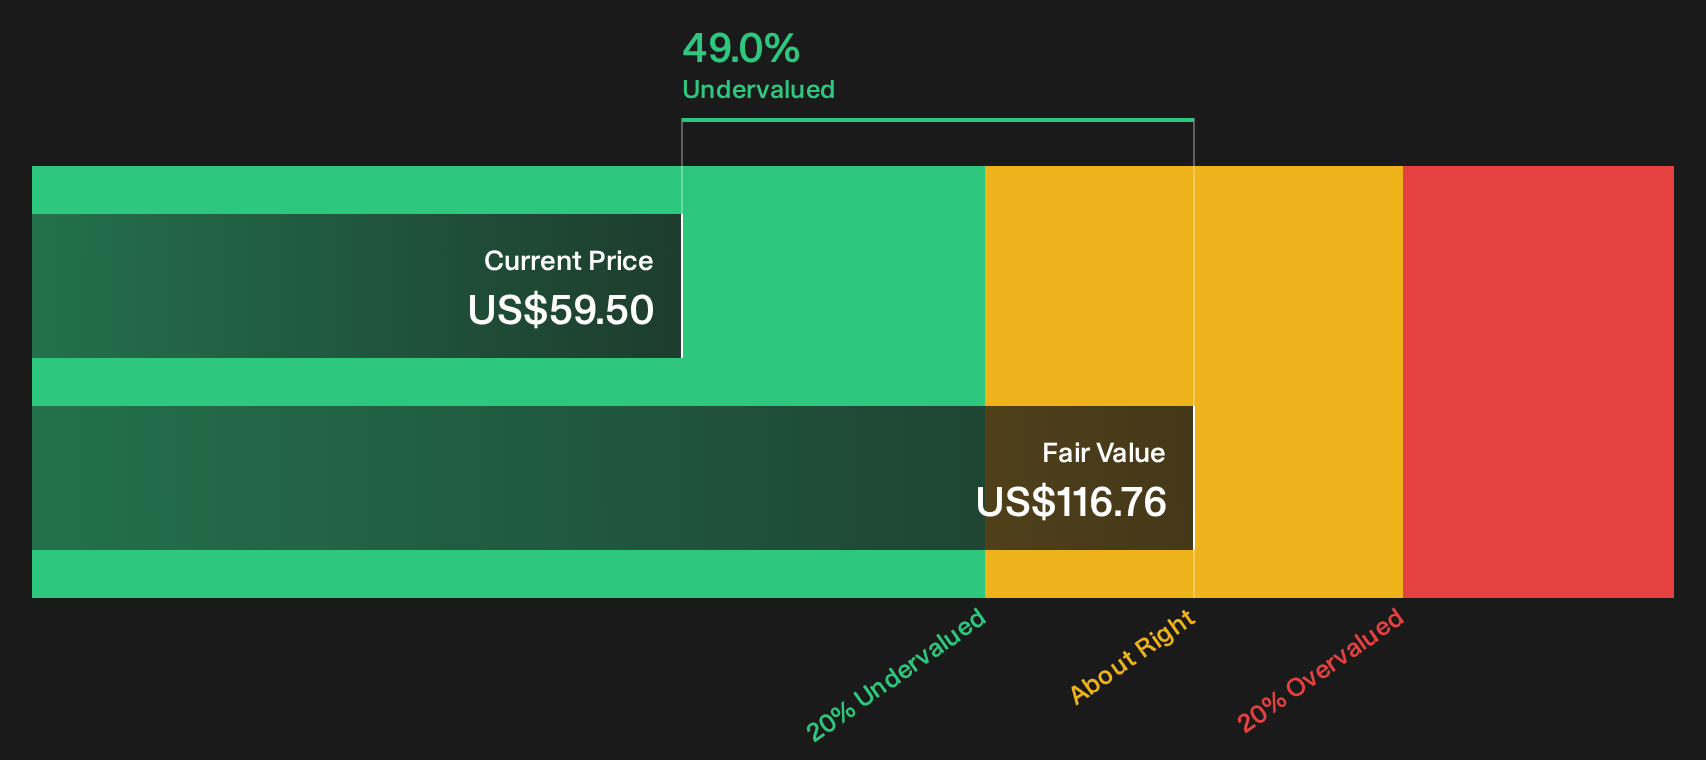
The Discounted Cash Flow (DCF) approach asks what Realty Income is worth today based on the cash it is expected to generate for shareholders. Realty Income is modeled on a 2 Stage Free Cash Flow to Equity framework using adjusted funds from operations, with latest twelve month free cash flow of about $3.9b and projections that assume growing cash flows rather than a sharp ramp up or decline. On those inputs, the model arrives at an estimated intrinsic value of about $116.76 per share.
Compared with the current share price, this DCF outcome indicates the stock is trading at roughly a 49.0% discount, which screens as materially undervalued on a cash flow basis. Because the 5.3% dividend yield has just been reaffirmed with the 136th consecutive monthly increase, the continued income focus helps explain why the DCF framework assigns substantial value to Realty Income’s long horizon cash stream.
On this Discounted Cash Flow view, Realty Income stock appears undervalued relative to the cash it is expected to return to shareholders.
Our Discounted Cash Flow (DCF) analysis suggests Realty Income is undervalued by 49.0%. Track this in your watchlist or portfolio, or discover 31 more high quality undervalued stocks.
Has Realty Income Run Too Far on Earnings?
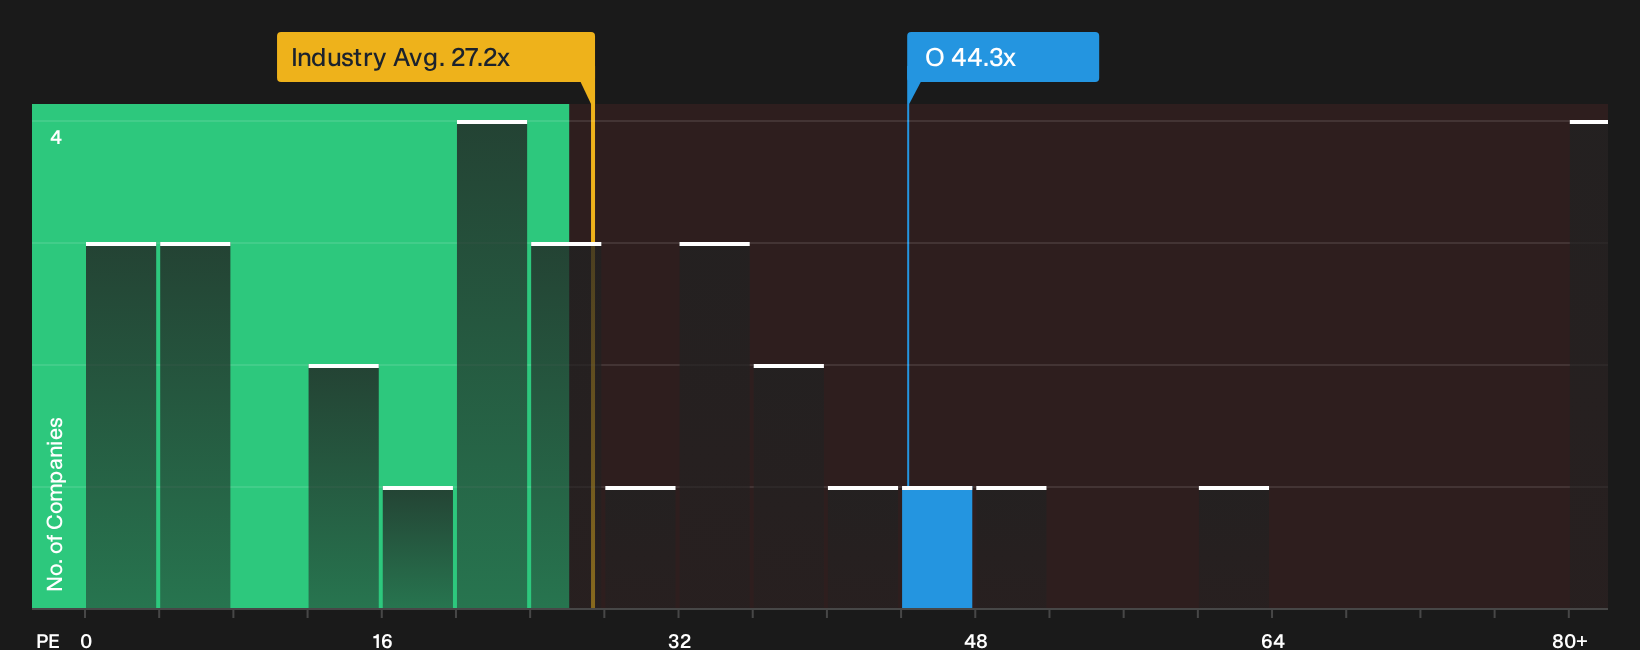
The P/E ratio matters for Realty Income because investors often anchor dividend stocks to the earnings that support those payouts. On this score, the stock trades at about 44.3x earnings, which is well above the Retail REITs industry average of roughly 27.2x and also higher than the peer group near 26.8x.
The fair P/E that factors in the sector, business profile and risk comes out closer to 36.6x. That is still below where Realty Income changes hands now, so the current price builds in a richer earnings multiple than this framework implies, even accounting for its scale and income focus.
On the P/E yardstick, Realty Income appears overvalued compared with both its tailored fair multiple and the broader Retail REIT peer group.
See what the numbers say about this price — find out in our valuation breakdown.
The Realty Income Narrative: What Would Justify Today's Price?
Simply Wall St Narratives pick up where this Realty Income valuation puzzle leaves off by spelling out which paths for future growth, margins and earnings would need to play out for the current price to make sense, or to look materially too high or too low. Where a single ratio or model produces one neat number, these scenarios set out the specific future that figure rests on so you can watch how far reality tracks that story over time.
One of the top community narratives on Realty Income: 16% undervalued
"Realty Income is a reliable dividend payer, with low uncertainty that makes this company a safe bet for every dividend investor…"
Read one of the top narratives on Realty Income
Do you think there's more to the story for Realty Income? Head over to our Community to see what others are saying!
The Bottom Line
Realty Income throws up a split verdict. The Discounted Cash Flow (DCF) intrinsic value estimate points to a large discount, while the richer P/E multiple says the stock already prices in generous expectations compared with peers. That tension reflects a clash between cash flow timing and capital needs on one side and market sentiment and growth assumptions on the other, with the low overall value score warning that the broader checks lean cautious. The real hinge from here is whether Realty Income’s rental income and tenant resilience justify the cash flow story or whether current pricing is closer to a value trap than a long term opportunity.
This article by Simply Wall St is general in nature. We provide commentary based on historical data and analyst forecasts only using an unbiased methodology and our articles are not intended to be financial advice. It does not constitute a recommendation to buy or sell any stock, and does not take account of your objectives, or your financial situation. We aim to bring you long-term focused analysis driven by fundamental data. Note that our analysis may not factor in the latest price-sensitive company announcements or qualitative material. Simply Wall St has no position in any stocks mentioned.
Have feedback on this article? Concerned about the content? Get in touch with us directly. Alternatively, email editorial-team@simplywallst.com