
IDEX (IEX) Stock Trades At A Discount To Fair Value
IDEX stock has delivered a 41.7% gain over the past year, yet the valuation picture is split, with an intrinsic value estimate pointing to upside while traditional market multiples lean the other way. For investors, that contrast raises questions about how much of IDEX's cash flow potential is already reflected in the current share price around US$224.
- The 41.7% 1 year return signals strong recent enthusiasm for IDEX, which can limit the margin of error if expectations prove too optimistic.
- Ongoing execution on cash generation may support the intrinsic value case for IDEX. However, any squeeze on margins or capital intensity could weaken that view.
- The broader valuation checks lean expensive for IDEX, with the company screening as attractive on only 1 of 6 value measures.
The issue now is whether the market price of IDEX already reflects its cash flow outlook or still leaves room relative to the intrinsic value estimate.
Compare IDEX's mixed valuation signals with a curated set of other potential opportunities by scanning 31 high quality undervalued stocks, which also combine strong fundamentals with pricing that screens as attractive.
Is IDEX a Bargain on Cash Flow?
The Discounted Cash Flow (DCF) approach here focuses on the cash that IDEX can plausibly return to shareholders over time. Latest twelve month free cash flow of about $641.9 million anchors the model, with analysts and extensions of their estimates pointing to growing cash generation rather than a shrinking profile.
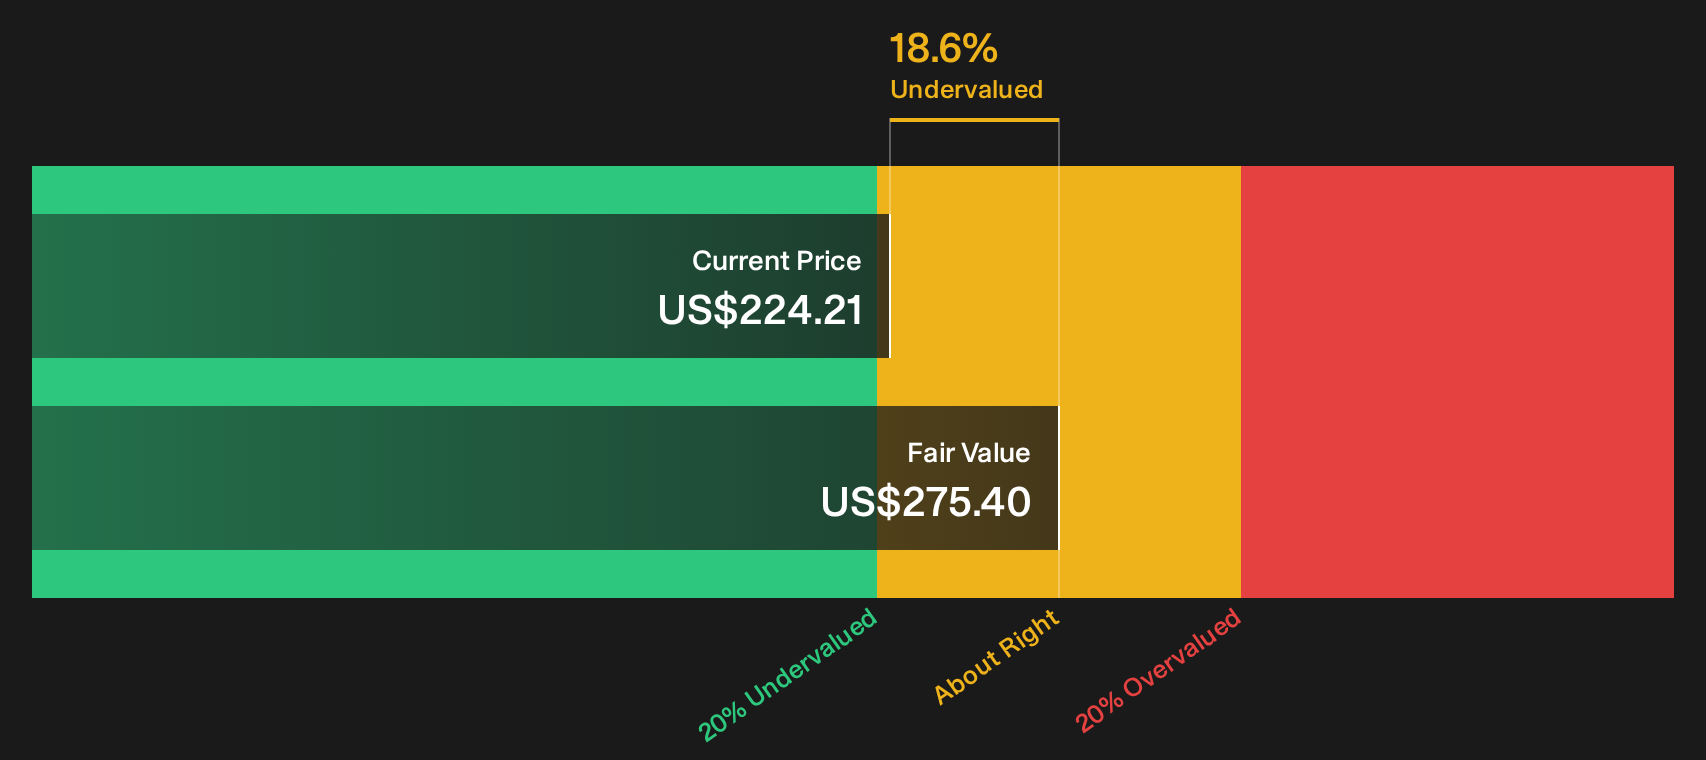
On those projections, the DCF model arrives at an intrinsic value of about $275 per share, using a 2 Stage Free Cash Flow to Equity framework that tapers growth as IDEX matures. Against the recent share price around $224, that implies the stock trades at roughly an 18.6% discount to this cash flow based estimate.
On this cash flow view, IDEX stock appears undervalued relative to the DCF based intrinsic value.
Our Discounted Cash Flow (DCF) analysis suggests IDEX is undervalued by 18.6%. Track this in your watchlist or portfolio, or discover 31 more high quality undervalued stocks.
Is IDEX Getting Expensive on Earnings?
P/E fits IDEX well because earnings remain the main anchor for how the market judges its progress.
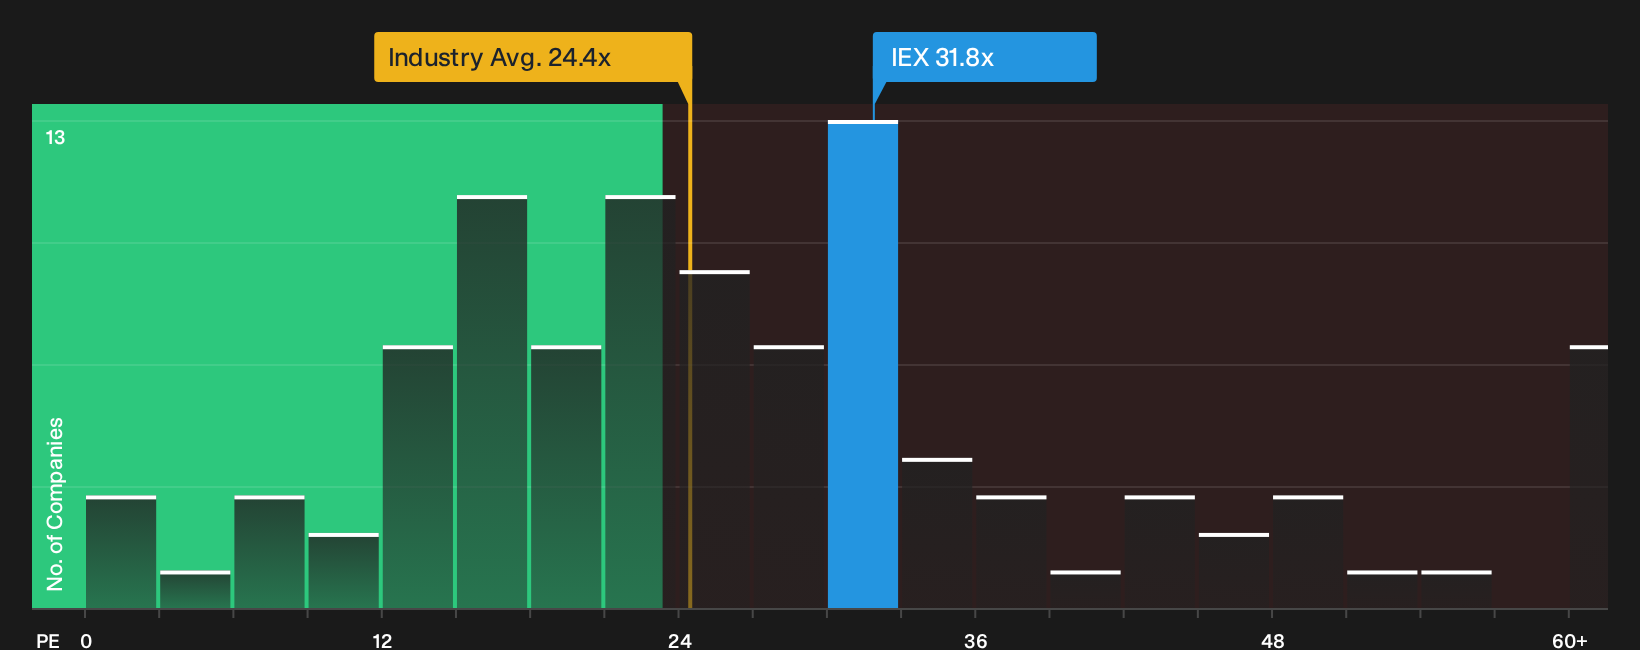
On this measure, IDEX trades at about 31.8x earnings. The broader Machinery industry sits closer to 24.4x, while a peer group clusters around 31.0x. The stock is therefore priced above the sector as a whole and roughly in line with similar businesses that investors already treat as premium quality.
A more tailored yardstick puts IDEX's fair P/E near 23.8x, based on its sector, profitability profile and risk. That is well below the current multiple, which means buyers today are paying a richer price than this framework implies for each dollar of earnings.
On the P/E lens alone, IDEX stock appears overvalued because its earnings multiple sits noticeably above this modelled fair level.
See what the numbers say about this price — find out in our valuation breakdown.
The IDEX Narrative: What Would Justify Today's Price?
Simply Wall St Narratives for IDEX link the valuation puzzle to concrete expectations for the business. These short storylines spell out what would need to happen to IDEX's growth, profitability and earnings for the shares to be worth meaningfully more or less than today’s price on the Community page. Where a single ratio or model gives one number, Narratives unpack the future that number relies on so you can watch whether reality lines up.
Share a narrative on IDEX that lays out your number-driven case on where its growth, margins, and execution go from here, then watch how that thesis tracks against future results.
Do you think there's more to the story for IDEX? Head over to our Community to see what others are saying!
The Bottom Line
IDEX looks undervalued on a Discounted Cash Flow (DCF) view, yet screens overvalued on earnings, which leaves the verdict finely balanced. The gap comes from what each lens rewards, with the intrinsic value model leaning on cash generation and capital needs, while the P/E view reflects how much optimism is already baked into comparable industrial stocks. Broader checks lean weak, so that single DCF signal carries more caveats than usual. The real swing factor from here is whether IDEX can keep turning revenue into consistent free cash flow without eroding margins. That will decide if the current premium earnings multiple holds or resets lower.
This article by Simply Wall St is general in nature. We provide commentary based on historical data and analyst forecasts only using an unbiased methodology and our articles are not intended to be financial advice. It does not constitute a recommendation to buy or sell any stock, and does not take account of your objectives, or your financial situation. We aim to bring you long-term focused analysis driven by fundamental data. Note that our analysis may not factor in the latest price-sensitive company announcements or qualitative material. Simply Wall St has no position in any stocks mentioned.
Have feedback on this article? Concerned about the content? Get in touch with us directly. Alternatively, email editorial-team@simplywallst.com