
Power Corporation of Canada (TSX:POW), What Is Behind The Fresh Attention?
Why the Power Corporation of Canada Stock Story Just Got More Interesting
Power Corporation of Canada (TSX:POW) is back in the spotlight after its Power Sustainable unit outlined plans to invest and mobilize more than CA$10b into Canadian infrastructure over the next five years.
Recent trading reflects that this CA$10b infrastructure push is landing on an already strong run for Power Corporation of Canada. The share price is up 31.2% year to date and the 1 year total shareholder return is 65.52%. The 3 year total shareholder return of 184.68% signals momentum that has been building over several years rather than just from this latest announcement.
Scan other infrastructure focused plays that are catching similar momentum in Canada with our hand picked 39 power grid technology and infrastructure stocks built for this kind of capital shift.
Power Corporation of Canada has a broad financial footprint and a fresh CA$10b infrastructure plan that has attracted attention. The harder question now is whether the recent share price run already reflects that strength.
Price-to-Earnings of 22.6x: Is It Justified?
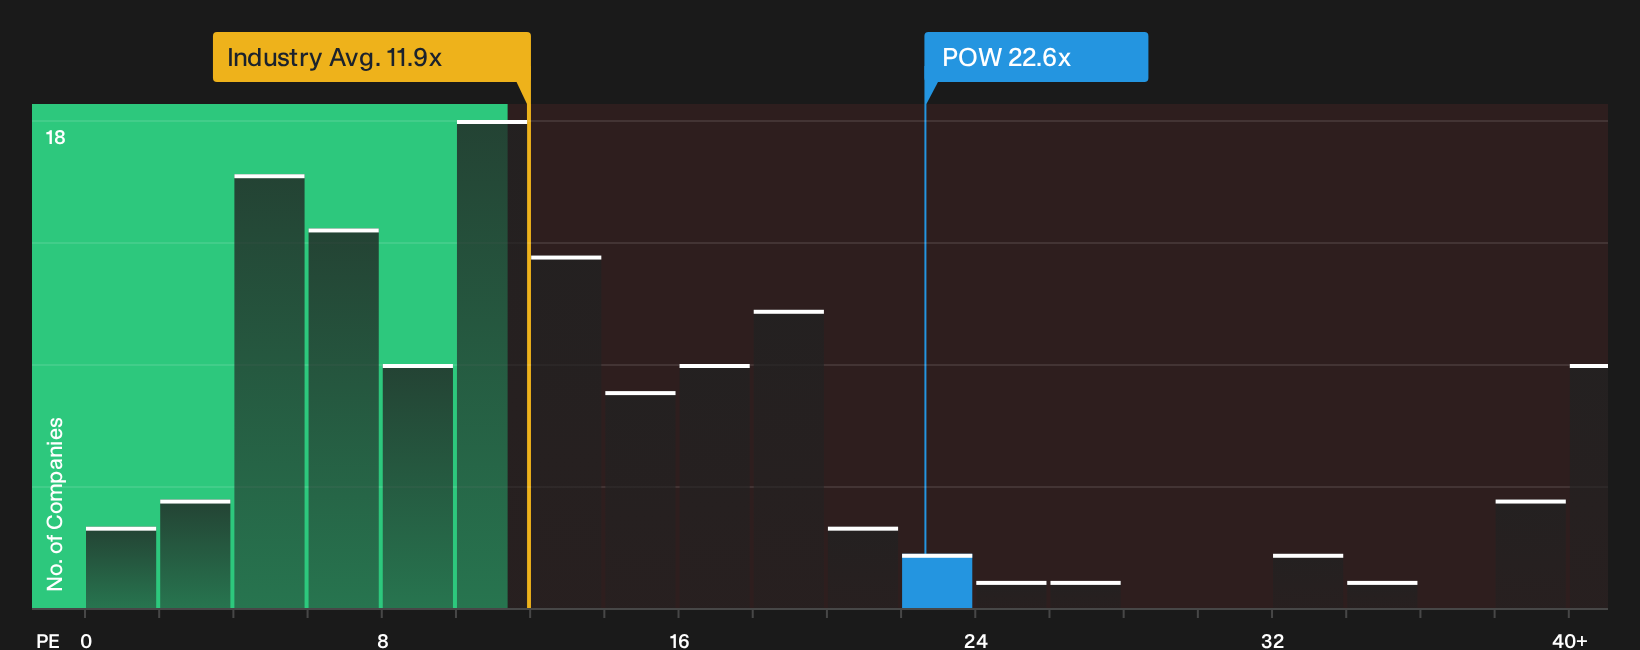
Power Corporation of Canada now trades on a P/E of 22.6x, which sits well above both its own estimated fair level and the wider insurance peer group.
The P/E ratio compares the current CA$94.37 share price with the firm’s earnings per share. Investors effectively pay CA$22.60 for every CA$1 of annual profit at this valuation. For a diversified financial group like Power Corporation of Canada, that figure gives a quick sense of how much the market is willing to pay for current earnings power.
Relative to the North American insurance sector, that 22.6x multiple is rich. Peers trade on an average P/E of 11.8x, so the stock is priced at almost double that level. In addition, the estimated fair P/E for Power Corporation of Canada is 15.2x, which sits well below the current market rating and points to a level the valuation could gravitate toward if sentiment cools.
For more detail on how this fair ratio is calculated and how it compares across peers, Explore the SWS fair ratio for Power Corporation of Canada
Result: Price-to-Earnings of 22.6x (OVERVALUED)
Still, the story around Power Corporation of Canada could shift quickly if sentiment toward higher valuation financials cools, or if the CA$10b infrastructure ambitions face execution setbacks.
Find out about the key risks to this Power Corporation of Canada narrative.
Another View On Power Corporation of Canada’s Value
The first check painted Power Corporation of Canada as expensive on a 22.6x P/E, both against peers and its own fair ratio. A second lens does not really let it off the hook.
The stock trades at 22.6x earnings while the North American insurance group averages 11.8x and peers sit around 17.6x. The fair ratio for Power Corporation of Canada is 15.2x. That gap suggests investors are already paying up for what they view as quality earnings and a 2.83% dividend, which may leave less room if sentiment cools or earnings progress disappoints.
It raises a simple question for you: Is this premium something you are comfortable paying for a diversified financial group with modest earnings growth and a 10% return on equity.
See what the numbers say about this price — find out in our valuation breakdown.
Simply Wall St performs a discounted cash flow (DCF) on every stock in the world every day (check out Power Corporation of Canada for example). We show the entire calculation in full. You can track the result in your watchlist or portfolio and be alerted when this changes, or use our stock screener to discover 5 high quality undervalued stocks. If you save a screener we even alert you when new companies match - so you never miss a potential opportunity.
Next Steps
Plenty of optimism has been priced into Power Corporation of Canada, yet the data also flag real concerns and potential upsides that deserve your own scrutiny. If you want a sharper sense of both sides before making any move, review the 2 key rewards and 1 important warning sign
Looking for more investment ideas beyond Power Corporation of Canada?
If you only focus on Power Corporation of Canada, you might miss other opportunities that fit your goals even better, so broaden your search before capital moves elsewhere.
- Kickstart a value hunt by scanning our 5 high quality undervalued stocks that blend stronger fundamentals with cheaper market pricing.
- Target stability and income by focusing on 2 dividend fortresses built around higher yields and sturdier cash flows.
- Spot resilient opportunities by running through a 1 resilient stocks with low risk scores that aims to keep downside potential more contained.
This article by Simply Wall St is general in nature. We provide commentary based on historical data and analyst forecasts only using an unbiased methodology and our articles are not intended to be financial advice. It does not constitute a recommendation to buy or sell any stock, and does not take account of your objectives, or your financial situation. We aim to bring you long-term focused analysis driven by fundamental data. Note that our analysis may not factor in the latest price-sensitive company announcements or qualitative material. Simply Wall St has no position in any stocks mentioned.
Have feedback on this article? Concerned about the content? Get in touch with us directly. Alternatively, email editorial-team@simplywallst.com