
Is TJX Companies (TJX) Stock Too Expensive After A 92% Run?
TJX Companies stock has delivered a strong 92.4% gain over the past five years, yet the latest intrinsic value work suggests the current share price may sit above what its cash flows justify. With the market multiples looking roughly in line and a low broader value score, investors are left weighing whether the recent pullback has gone far enough to change that picture.
- A 92.4% return over five years highlights how well long term holders of TJX Companies have done. This raises the bar for new buyers looking for a clear value edge.
- The off price retail model can support steady cash generation in a range of demand conditions. At the same time, any pressure on consumer spending or sourcing costs may limit how much profit the business can reasonably sustain over time.
- The broader valuation checks rate TJX Companies as expensive overall, with the stock screening as attractive on only 1 of 6 metrics, which points to a profile that leans rich rather than clearly cheap.
The issue now is whether the current share price of TJX Companies offers a sufficient margin of safety relative to the intrinsic value estimate based on Discounted Cash Flow.
Contrast TJX Companies with a curated group of other potential opportunities by scanning 31 high quality undervalued stocks, which already pair solid financials with more modest valuations.
Is TJX Companies Getting Expensive on Cash Flow?
The Discounted Cash Flow (DCF) model here projects what TJX Companies might generate in future free cash and brings that back to today’s dollars. On the latest numbers, the business produced about $5.9b in free cash flow over the last twelve months, and the model assumes that cash flow profile continues from this base rather than shrinking.
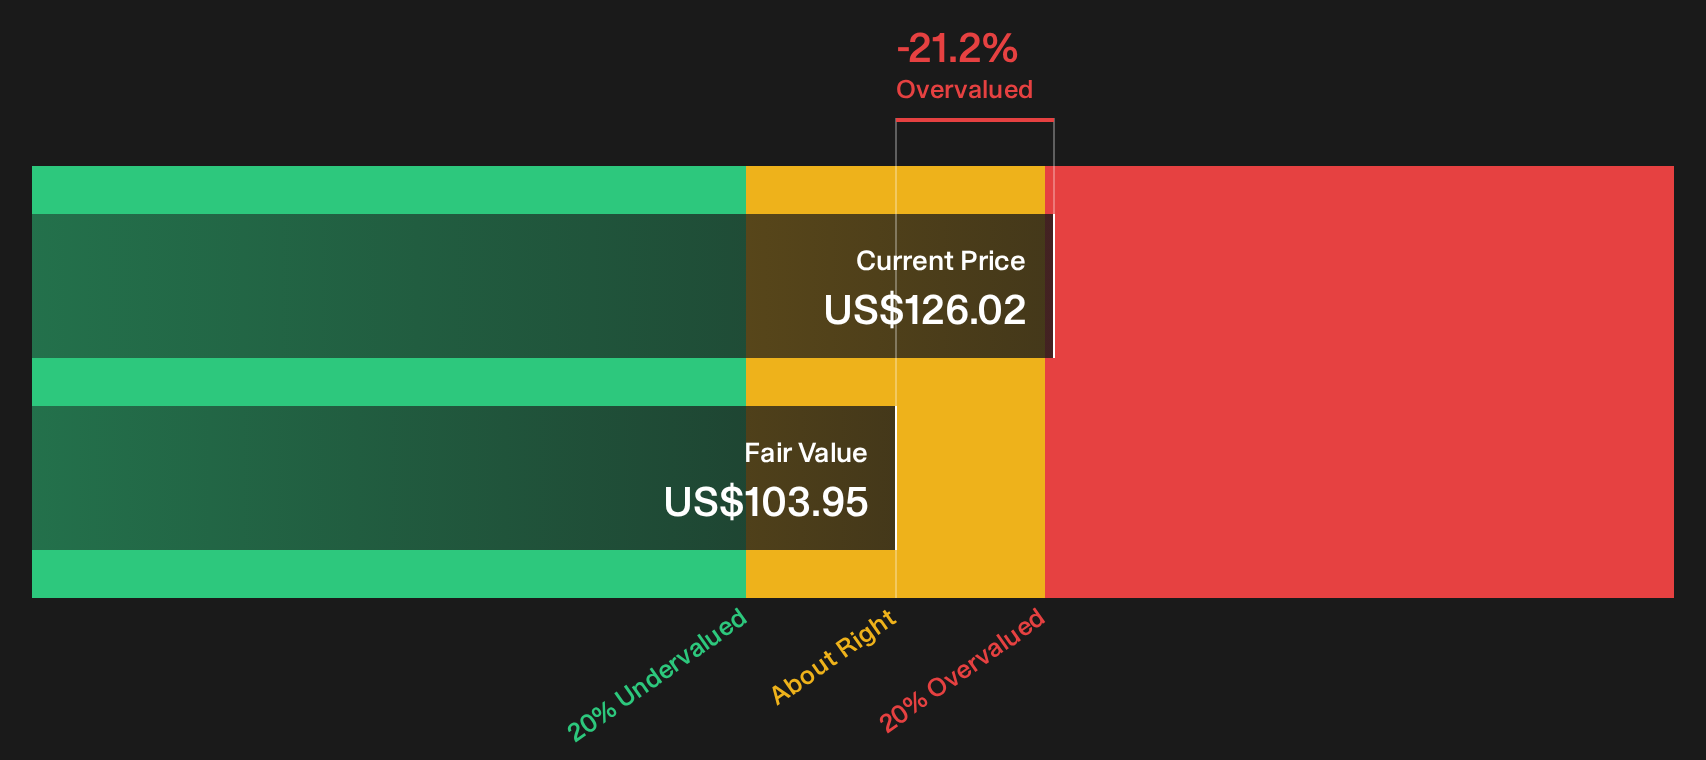
Using those inputs, the DCF points to an estimated intrinsic value of about $104 per share, which is below where TJX Companies currently trades. That gap aligns with the calculated 21.2% premium to the DCF estimate, so the current price reflects relatively full expectations for what its off-price model can deliver.
On this DCF view, TJX Companies stock appears overvalued relative to its projected cash generation.
Our Discounted Cash Flow (DCF) analysis suggests TJX Companies may be overvalued by 21.2%. Discover 31 high quality undervalued stocks or create your own screener to find better value opportunities.
Is TJX Companies Fairly Priced on Earnings?
P/E works well for TJX Companies because earnings quality and consistency often matter more than headline sales for an off price retailer.
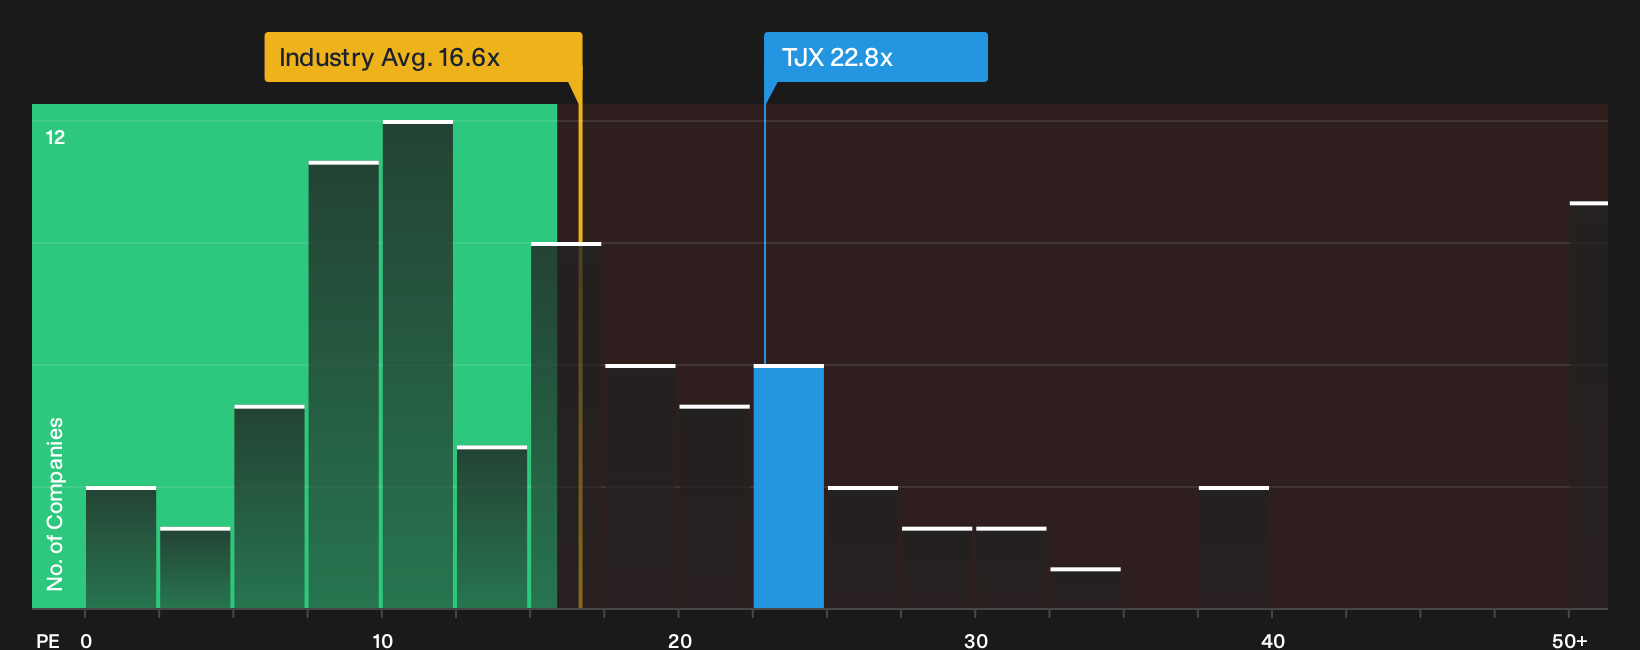
The stock currently trades at about 22.8x earnings, which is above both the specialty retail industry average of roughly 16.6x and the peer pack around 16.7x. The fair P/E derived for TJX Companies sits near 21.1x. That is close to the actual multiple and still points to investors paying a modest premium versus what the model suggests would be typical for this level of quality and risk.
There is a gap to the sector, but the tailored fair ratio tempers that signal and indicates a valuation that is not aggressively stretched on earnings alone.
On this earnings yardstick, TJX Companies looks priced roughly in line with what the model considers a fair P/E multiple.
See what the numbers say about this price — find out in our valuation breakdown.
The TJX Companies Narrative: What Would Justify Today's Price?
Narratives for TJX Companies pick up where the valuation puzzle leaves off and spell out which paths for growth, margins and earnings would need to unfold for the stock to be worth materially more or materially less than today's price. Instead of stopping at a single model output, they lay out the future that number relies on so you can watch how TJX Companies' actual progress lines up with the story. These are available on Simply Wall St's Community page.
One of the top community narratives on TJX Companies: 27% undervalued
"Management emphasized robust merchandise availability due to excess inventory in the market, which allows TJX's experienced global buying teams to secure quality branded goods at favorable prices…"
Read one of the top narratives on TJX Companies
Do you think there's more to the story for TJX Companies? Head over to our Community to see what others are saying!
The Bottom Line
TJX Companies screens as overvalued on the Discounted Cash Flow (DCF) work, while the P/E view suggests the shares are only slightly above what looks like a typical earnings multiple for this kind of retailer. That mix, combined with a low broader value score, points to a setup where expectations already build in a lot of faith in the off price formula. The real swing factor now is whether TJX Companies can keep translating its buying scale and merchandising discipline into cash flows strong enough to justify that richer intrinsic value.
This article by Simply Wall St is general in nature. We provide commentary based on historical data and analyst forecasts only using an unbiased methodology and our articles are not intended to be financial advice. It does not constitute a recommendation to buy or sell any stock, and does not take account of your objectives, or your financial situation. We aim to bring you long-term focused analysis driven by fundamental data. Note that our analysis may not factor in the latest price-sensitive company announcements or qualitative material. Simply Wall St has no position in any stocks mentioned.
Have feedback on this article? Concerned about the content? Get in touch with us directly. Alternatively, email editorial-team@simplywallst.com