
Lennox (LII) Stock May Be 44% Undervalued On Cash Flow
Lennox International has had a difficult year for shareholders, with the stock down 32.1% over the past 12 months, yet both an intrinsic value estimate and market multiples still suggest the shares may be pricing in more pessimism than the underlying cash flows imply. The key issue is that a discounted cash flow based intrinsic value points to meaningful upside versus the current US$366.04 share price, while the recent price slide raises questions about how much of that gap truly reflects long term business risks.
- The share price has fallen 32.1% over the past year, which means anyone looking at Lennox International today is assessing a stock that has already reset lower.
- Valuation can be helped by the company’s ability to convert earnings into cash and sustain margins in its heating and cooling businesses, while a weaker demand cycle or cost inflation may squeeze those same margins and slow cash generation.
- The broader checks lean cheap, with the stock screening as undervalued in 6 out of 6 valuation tests, which points to a consistent discount across methods rather than a single outlier model.
For investors, the debate is whether Lennox International’s current discount to intrinsic value and to typical market multiples fairly reflects its risks or leaves room for a re rating if business performance holds up.
Compare Lennox International’s valuation reset with a curated list of other potentially mispriced opportunities by scanning 31 high quality undervalued stocks, which also pair solid fundamentals with compressed expectations.
Does Lennox International Look Undervalued on Cash Flow?
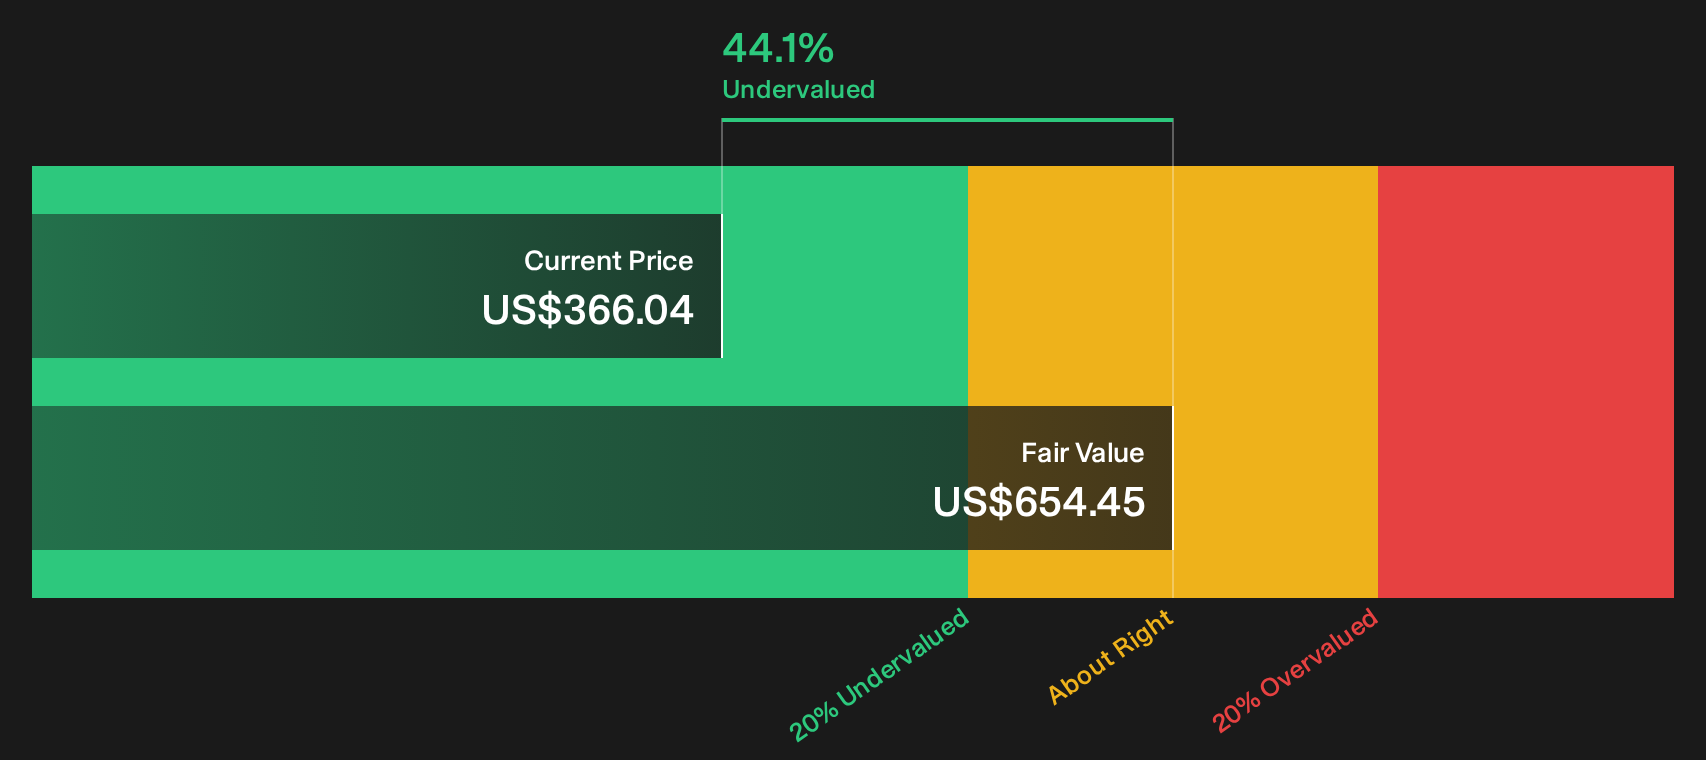
The Discounted Cash Flow (DCF) model here focuses on the cash Lennox International can return to shareholders over time, adjusted back to today’s dollars. Lennox International generated about $713.3 million in free cash flow over the latest twelve months, which gives the model a solid current cash base rather than relying only on distant forecasts.
Analysts and extrapolated estimates in this example point to increasing free cash flow over the coming decade, with projections rising into the low billions of dollars before discounting. Feeding those projections into a 2 Stage Free Cash Flow to Equity framework produces an illustrative intrinsic value estimate of about $654 per share, compared with the current $366.04 share price in this scenario. That gap implies the stock appears roughly 44.1% undervalued based on this DCF output.
On this illustrative DCF view, Lennox International appears undervalued relative to the cash it is modeled to generate in this scenario.
Our Discounted Cash Flow (DCF) analysis suggests Lennox International is undervalued by 44.1%. Track this in your watchlist or portfolio, or discover 31 more high quality undervalued stocks.
Is Lennox International a Bargain on Earnings?
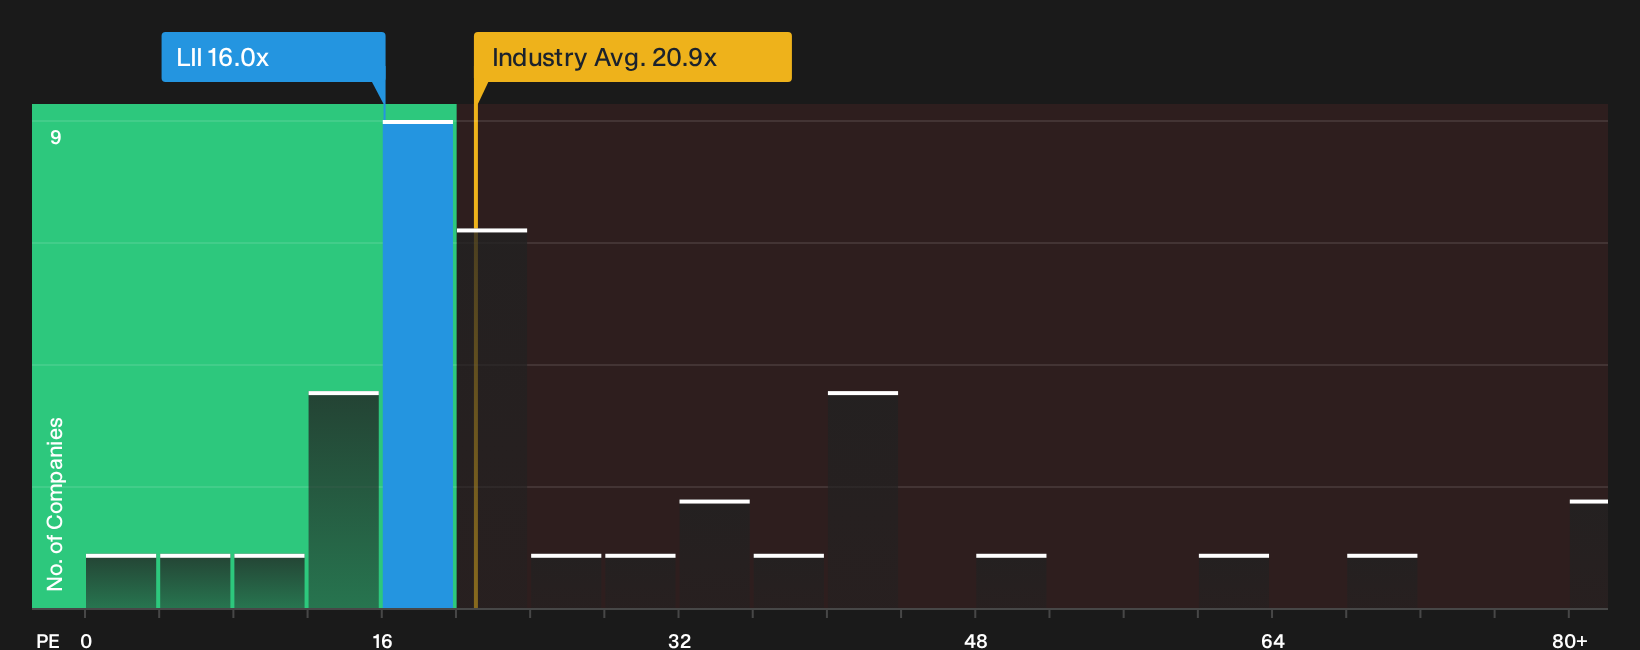
P/E works well for Lennox International because earnings for this type of heating and cooling manufacturer tend to be a key anchor for how the market judges it. On current numbers, Lennox International trades at roughly 16.0x earnings, which comes in below both the building industry average P/E of about 20.9x and a peer group closer to 35.5x.
The model that blends factors such as size, profitability and risk suggests a fair P/E closer to 24.5x for Lennox International. That is a sizable gap to the current 16.0x multiple, and it points to a stock that is priced more like a middle-of-the-pack industrial than the peer basket it screens against. For investors comparing quick valuation markers, the earnings multiple lines up with the DCF work and points to a similar conclusion.
On the P/E yardstick, Lennox International appears undervalued relative to both its tailored fair multiple and the typical pricing of comparable businesses.
See what the numbers say about this price — find out in our valuation breakdown.
The Lennox International Narrative: What Would Justify Today's Price?
Simply Wall St Narratives pick up where Lennox International's valuation puzzle leaves off. They spell out which combinations of future growth, profitability and earnings power would need to play out for the stock to be worth materially more or less than today in the market. Each one treats fair value as a hypothesis about Lennox International's business that you can revisit over time rather than a one off snapshot.
One of the top community narratives on Lennox International: 28% undervalued
"Investments in digital platforms, AI-based pricing tools, and proprietary data analytics are enabling Lennox to optimize pricing, streamline dealer interactions, and maintain premium pricing power…"
Read one of the top narratives on Lennox International
Do you think there's more to the story for Lennox International? Head over to our Community to see what others are saying!
The Bottom Line
Lennox International screens as undervalued on both the Discounted Cash Flow (DCF) intrinsic value estimate and the earnings multiple work, which points to a consistent discount rather than a single quirky model. The core question is whether the business can keep converting earnings into resilient cash flows so that the current pricing gap eventually narrows instead of widening. For you as an investor, everything now depends on whether margins and demand in the heating and cooling operations hold up well enough to avoid this becoming a value trap where the low valuation simply reflects lasting pressure on cash generation.
This article by Simply Wall St is general in nature. We provide commentary based on historical data and analyst forecasts only using an unbiased methodology and our articles are not intended to be financial advice. It does not constitute a recommendation to buy or sell any stock, and does not take account of your objectives, or your financial situation. We aim to bring you long-term focused analysis driven by fundamental data. Note that our analysis may not factor in the latest price-sensitive company announcements or qualitative material. Simply Wall St has no position in any stocks mentioned.
Have feedback on this article? Concerned about the content? Get in touch with us directly. Alternatively, email editorial-team@simplywallst.com