
Is West Japan Railway (TSE:9021) Fairly Valued Following Japan Pilgrimage Tourism Partnership News?
JR East’s new pilgrimage tourism partnership with four Japanese transport groups has drawn fresh attention to West Japan Railway (TSE:9021), as investors gauge what coordinated regional travel initiatives might mean for JR-focused travel demand and ancillary services.
At a ¥2,998 share price, West Japan Railway has seen a 16.31% 90 day share price return and a 4.48% 30 day share price return, yet the total shareholder return is down 7.79% over the past year. This signals improving short term momentum after a weaker longer term experience for holders.
Scan other travel and infrastructure opportunities that are moving on tourism themes similar to West Japan Railway’s story by running the curated 73 high quality undiscovered gems.
West Japan Railway’s share price recovery meets a modest 3.6% discount to analyst targets, which leaves a simple tension. Is the recent caution about earnings and tourism exposure still doing useful work in the valuation, or not?
Price-to-earnings of 11.6x for West Japan Railway: Is it justified?
On valuation, West Japan Railway trades on a P/E of 11.6x, which screens as inexpensive relative to both peers and the wider JP market based on current metrics.
The P/E ratio compares what investors are paying for each unit of current earnings. For rail and transport operators like West Japan Railway, it gives a quick read on how the market is pricing the stability of cash flows, capital intensity, and exposure to tourism and commuter volumes.
Analysts flag that 9021 is on a lower earnings multiple than the peer average of 15.1x and also below the JP Transportation industry average of 12.1x. The stock is also assessed as trading at good value relative to an estimated fair P/E of 15.7x. This is described as a level the market could move towards if sentiment on earnings quality and cash generation improved.
For investors who want to understand how that fair P/E benchmark is calculated and applied across the sector, Explore the SWS fair ratio for West Japan Railway
Result: Price-to-earnings of 11.6x (UNDERVALUED)
Still, the West Japan Railway story faces risks if tourism-linked traffic underwhelms or if ongoing revenue growth of 2.66% does not translate into stronger net income.
Find out about the key risks to this West Japan Railway narrative.
Another view on West Japan Railway’s value
Against that seemingly cheap 11.6x P/E, the SWS DCF model paints a very different picture for West Japan Railway. With the share price at ¥2,998 and a future cash flow value estimate of ¥1,768.72, the stock screens as expensive on this method rather than cheap.
That gap suggests investors are paying materially more than our DCF view of long term cash flows, even though earnings are forecast to decline by an average of 0.2% per year over the next 3 years. It raises a simple question for you as a holder or prospective buyer: Is the current price more about confidence in recovery stories than in the cash flow math?
Look into how the SWS DCF model arrives at its fair value.
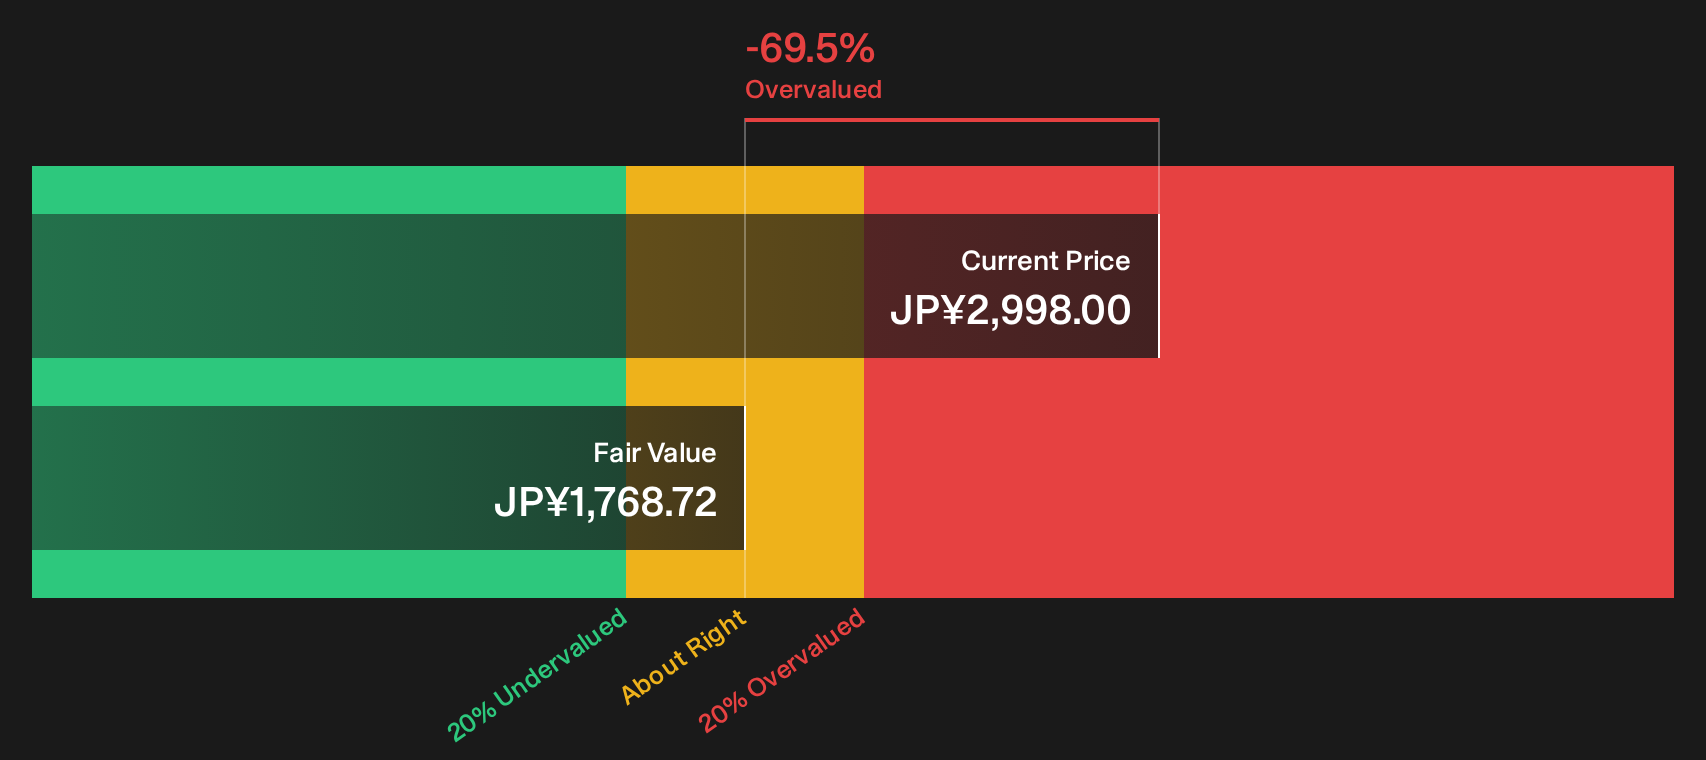
Simply Wall St performs a discounted cash flow (DCF) on every stock in the world every day (check out West Japan Railway for example). We show the entire calculation in full. You can track the result in your watchlist or portfolio and be alerted when this changes, or use our stock screener to discover 17 high quality undervalued stocks. If you save a screener we even alert you when new companies match - so you never miss a potential opportunity.
Next Steps
Mixed signals around West Japan Railway can feel confusing. Move quickly, pull up the full data set, and weigh both the upside and the pressure points using the 2 key rewards and 3 important warning signs
Looking for more investment ideas beyond West Japan Railway?
If West Japan Railway has you thinking harder about pricing power, cash flows and risk, do not stop with a single ticker. Push your watchlist further using focused screeners built around quality and resilience.
- Target value opportunities with stronger fundamentals by scanning our 17 high quality undervalued stocks tailored to highlight companies that pair reasonable pricing with solid business quality.
- Strengthen your income stream by reviewing the 19 dividend fortresses and filter for companies that combine higher yields with more resilient payout profiles.
- Dial down portfolio stress by assessing the 10 resilient stocks with low risk scores so you can concentrate on businesses that score better on balance sheet and volatility checks.
This article by Simply Wall St is general in nature. We provide commentary based on historical data and analyst forecasts only using an unbiased methodology and our articles are not intended to be financial advice. It does not constitute a recommendation to buy or sell any stock, and does not take account of your objectives, or your financial situation. We aim to bring you long-term focused analysis driven by fundamental data. Note that our analysis may not factor in the latest price-sensitive company announcements or qualitative material. Simply Wall St has no position in any stocks mentioned.
Have feedback on this article? Concerned about the content? Get in touch with us directly. Alternatively, email editorial-team@simplywallst.com