
Compass (COMP) Faces Growth And Profit Pressure, Is It A Bargain?
Recent remarks from Compass (COMP) executives have thrown a harsh spotlight on the company’s twin challenge. Profitability remains tight just as the U.S. housing market splits between resilient luxury demand and pressured entry level buyers.
Compass shares have been choppy this year, with the last close at $10.51 and a 1 month share price return down 17.4%, even after a 22.4% gain over the past 90 days. That pullback follows mixed reactions to merger driven revenue, softer earnings, and cautious guidance, while investors weigh a 12.4% 1 year total shareholder return and a very large 3 year total shareholder total return against ongoing questions about profitability and cash generation.
Spot emerging real estate and housing plays reacting to the same pressures as Compass by scanning our curated list of list of solid balance sheet and fundamentals (23 results).Compass now trades at a steep discount to both analyst targets and some intrinsic value estimates after that sharp swing in sentiment. Is the market simply too wary of its profit and cash flow record?
Most Popular Narrative: 31.8% Undervalued
Compass is tagged with a widely followed fair value estimate of $15.42, which sits above the recent $10.51 share price and frames a valuation gap that analysts link to execution on technology, luxury exposure, and merger benefits.
Rapid adoption and continuous improvement of Compass's AI-powered, end-to-end technology platform is increasing agent productivity, driving higher transaction volumes, improving retention, and is expected to widen margins as AI-driven process efficiencies scale throughout the organization, positively impacting revenue, EBITDA, and net margins.
Investors may want to see what kind of revenue curve and margin profile those platform gains are built on. The most followed Compass narrative leans on specific growth, profitability and valuation hurdles that need to line up for that $15.42 figure to hold. The detail is in the forecasts, not just the story.
Result: Fair Value of $15.42 (UNDERVALUED)
Have a read of the narrative in full and understand what's behind the forecasts.
Still, Compass faces real pressure if commission focused revenue slows, or if regulatory changes and litigation compress commission rates and unsettle agent recruitment and retention.
Find out about the key risks to this Compass narrative.
Another View on Compass Valuation
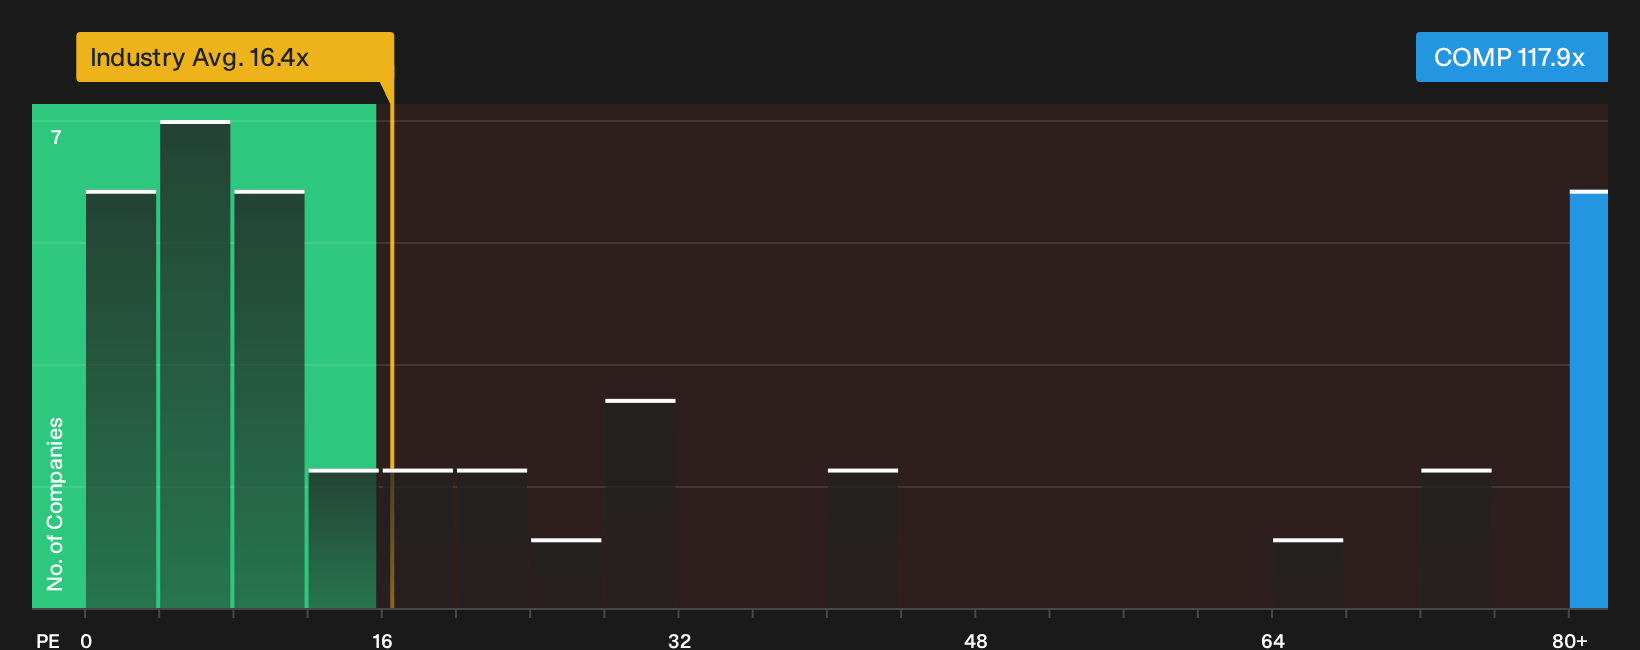
Multiples tell a very different story for Compass. The stock trades on a P/E of 117.9x, which is far above both the US Real Estate industry average of 16.3x and peers at 84.1x, and it also sits well above the 44.8x fair ratio that the market could eventually gravitate toward.
That kind of gap can point to either a rich price that leaves little room for missteps, or a market that is prepared to pay up for Compass if analysts are right about future earnings growth. Which side of that trade do you think you are on?
See what the numbers say about this price — find out in our valuation breakdown.
Next Steps
Viewed together, these mixed signals around Compass can feel messy. Look at the same data the market is watching, move quickly, and weigh the 4 key rewards and 3 important warning signs.
Looking for more ideas beyond Compass?
Do not stop with Compass alone. Broader context matters, and fresh watchlist candidates can sharpen how you judge risk, quality, and income potential across your portfolio.
- Target potential mispricing by scanning a focused pool of sturdier opportunities through the 31 high quality undervalued stocks.
- Strengthen your income stream by reviewing stocks that feature reliable cash payouts using the 6 dividend fortresses.
- Reduce portfolio stress by concentrating on companies that score well on financial resilience through the 11 resilient stocks with low risk scores.
This article by Simply Wall St is general in nature. We provide commentary based on historical data and analyst forecasts only using an unbiased methodology and our articles are not intended to be financial advice. It does not constitute a recommendation to buy or sell any stock, and does not take account of your objectives, or your financial situation. We aim to bring you long-term focused analysis driven by fundamental data. Note that our analysis may not factor in the latest price-sensitive company announcements or qualitative material. Simply Wall St has no position in any stocks mentioned.
Have feedback on this article? Concerned about the content? Get in touch with us directly. Alternatively, email editorial-team@simplywallst.com