
Timken (TKR) Stock Looks Below Fair Value On Cash Flow
Timken stock has nearly doubled over the past five years, yet the latest valuation checks paint a more nuanced picture. An intrinsic value estimate suggests the shares trade below what the cash flow outlook implies, while market multiples look closer to fair.
- Timken has returned 92.5% over five years, which puts recent short-term pullbacks into context as part of a much longer winning run.
- The key support for the current valuation is investors’ confidence in the company’s ability to keep converting earnings into cash, while any setback in cash generation or heavier capital spending could weigh on what buyers are willing to pay.
- The stock carries a mixed overall value profile, with a 4.0 value score that points to neither a clear bargain nor an obvious overvaluation.
The issue now is whether Timken’s recent share price around US$119 already reflects that intrinsic value estimate or still leaves a meaningful margin between price and cash flow potential.
Scan beyond Timken by comparing its cash-flow-driven valuation story to the hand picked opportunities in the 32 high quality undervalued stocks.
Does Timken Look Undervalued on Cash Flow?
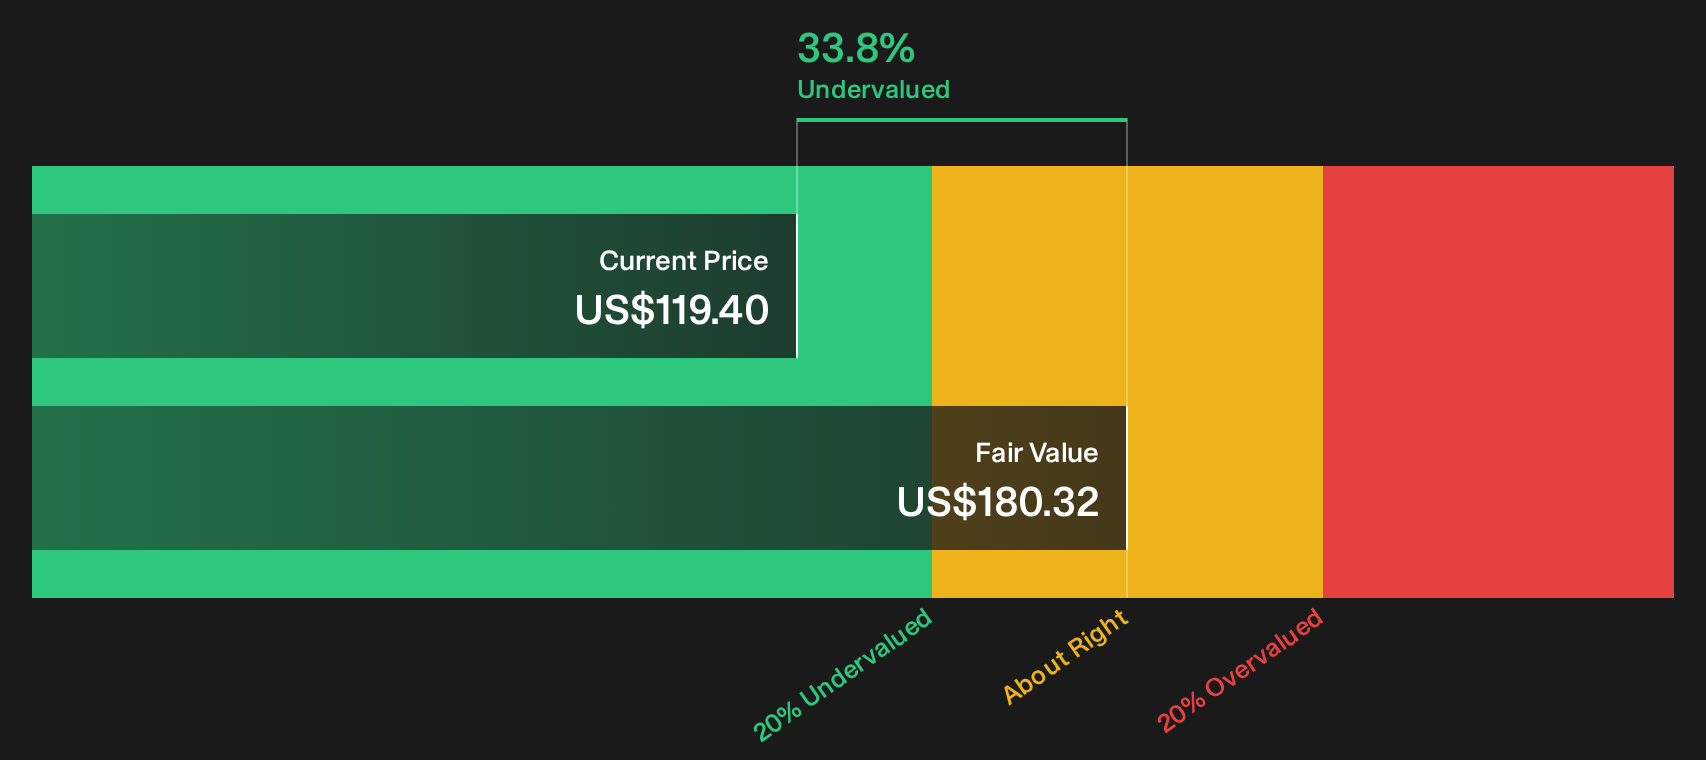
The Discounted Cash Flow model values Timken by projecting future free cash the business can return to shareholders and then discounting it back to today. For Timken, the latest twelve month free cash flow sits at about $366.2 million, and the forecast path assumes growing cash generation rather than a shrinking base.
On those projections, the model lands on an intrinsic value of about $180 per share. That sits above the recent price around $119, which implies a discount of roughly 33.8% to the cash flow estimate. The gap indicates that the current market price does not fully reflect the DCF view of Timken’s ability to keep producing and compounding free cash over time.
On this DCF view, Timken stock currently appears undervalued relative to its projected cash flows.
Our Discounted Cash Flow (DCF) analysis suggests Timken is undervalued by 33.8%. Track this in your watchlist or portfolio, or discover 32 more high quality undervalued stocks.
Is Timken Fairly Priced on Earnings?
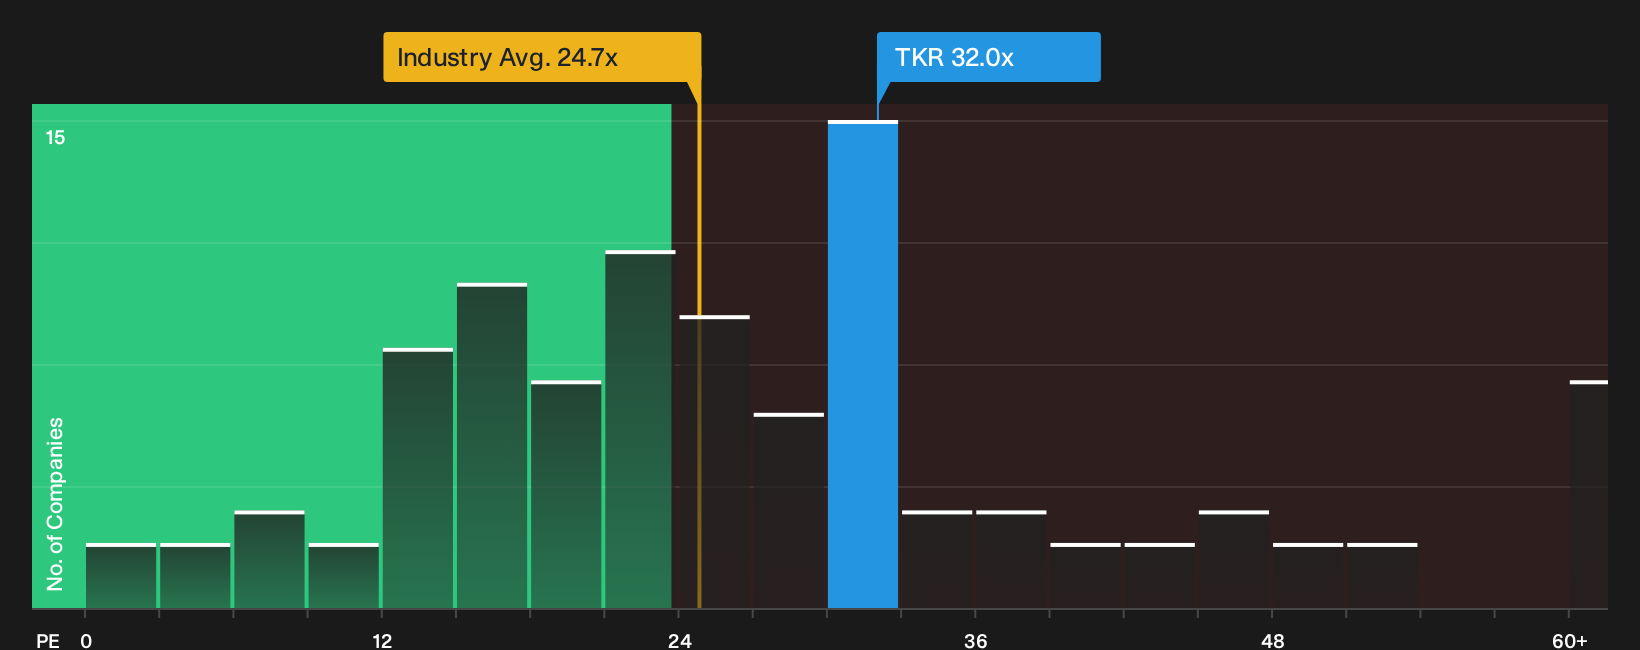
The P/E ratio fits Timken well because earnings remain the main anchor for how investors judge the business. Timken trades on about 32.0x earnings, which sits above both the broader machinery industry on 24.7x and the peer group average of 20.2x. On simple comparison, the stock changes hands at a premium to many comparable industrial manufacturers.
A fair P/E ratio for Timken, based on its specific profile, screens closer to 33.0x. That sits only slightly above the present multiple, so the gap between what the market pays today and what the model suggests as appropriate is modest. The result is a valuation that does not flag Timken as especially cheap or stretched relative to its earnings power.
On the P/E yardstick, Timken looks roughly fairly valued with only a small premium to its modelled fair multiple.
See what the numbers say about this price — find out in our valuation breakdown.
The Timken Narrative: What Would Justify Today's Price?
Simply Wall St Narratives pick up where Timken’s valuation puzzle leaves off by spelling out the future path for growth, margins and earnings that would need to play out for the share price to look meaningfully higher or lower than today. Where a single ratio or cash flow model gives one number, these break that number into concrete expectations so you can watch how Timken’s actual progress lines up over time on the Community page.
One of the top community narratives on Timken: 19% undervalued
"Several research updates cite expectations for higher margins over time, supported by leaner cost structures, greater use of automation and a focus on free cash flow…"
Read one of the top narratives on Timken
Do you think there's more to the story for Timken? Head over to our Community to see what others are saying!
The Bottom Line
Timken screens as undervalued on a Discounted Cash Flow (DCF) view, while the P/E work suggests the share price is already close to what the earnings profile supports. That mix leaves the valuation case balanced rather than one sided, with cash flow assumptions doing more of the heavy lifting than market multiples. What matters most from here is whether Timken keeps turning earnings into sturdy free cash without needing much heavier investment, since that will decide whether today’s discount looks like an opportunity or a fair reflection of execution risk.
This article by Simply Wall St is general in nature. We provide commentary based on historical data and analyst forecasts only using an unbiased methodology and our articles are not intended to be financial advice. It does not constitute a recommendation to buy or sell any stock, and does not take account of your objectives, or your financial situation. We aim to bring you long-term focused analysis driven by fundamental data. Note that our analysis may not factor in the latest price-sensitive company announcements or qualitative material. Simply Wall St has no position in any stocks mentioned.
Have feedback on this article? Concerned about the content? Get in touch with us directly. Alternatively, email editorial-team@simplywallst.com