
Amphenol (APH) Climbed, But What Is Driving Attention Now?
Conference spotlight and earnings momentum
Amphenol (APH) is heading into its Citi 2026 Global TMT Conference appearance in New York with fresh attention on its earnings and cash flow profile, supported by record orders and sustained demand.
Recent moves in Amphenol’s share price have reflected this upbeat narrative, with a 1-day share price return of 4.57% and a year-to-date share price return of 20.13%. These gains have helped underpin a 1-year total shareholder return of 42.39%, which points to momentum building rather than fading.
Scan beyond Amphenol and line up other potential beneficiaries of AI driven connectivity demand with the curated 89 AI infrastructure stocks.
After a 42.39% 1 year total return and a share price near US$83.92, Amphenol still trades at a discount to both analyst targets and intrinsic estimates. This raises the question of whether the market’s caution or the optimism in those models is misplaced.
Most Popular Narrative: 19.1% Undervalued
Against a last close of $83.92, the most followed narrative on Amphenol anchors fair value near $103.67, which frames the current discount clearly.
Amphenol is the physical layer of my thesis: the cables, connectors and fiber that everything else in the portfolio has to travel through.
I do not own it because it is the purest AI play in my book. It is not, and the narrative above says so plainly. I own it because it has the best forward indicator of anything I hold, with record orders at a 1.23 book-to-bill with guidance 7% above consensus. I also own it because it is the one position that does not require me to correctly predict which interconnect technology wins the next architectural cycle, and because in a book this concentrated there is real value in owning one company that can still sell something if the AI buildout takes a breath.
Want to see what sits behind that valuation gap. According to isidrohg, the fair value story leans heavily on strong revenue compounding, firm profitability and a future earnings multiple that assumes Amphenol keeps turning orders into high margin cash flow. Curious which specific growth and margin paths are baked into that $103.67 figure.
Result: Fair Value of $103.67 (UNDERVALUED)
Have a read of the narrative in full and understand what's behind the forecasts.
Still, the Amphenol story can fray quickly if hyperscaler capex slows or if margins compress as the product mix tilts from high speed copper toward optics.
Find out about the key risks to this Amphenol narrative.
Another view on Amphenol’s valuation
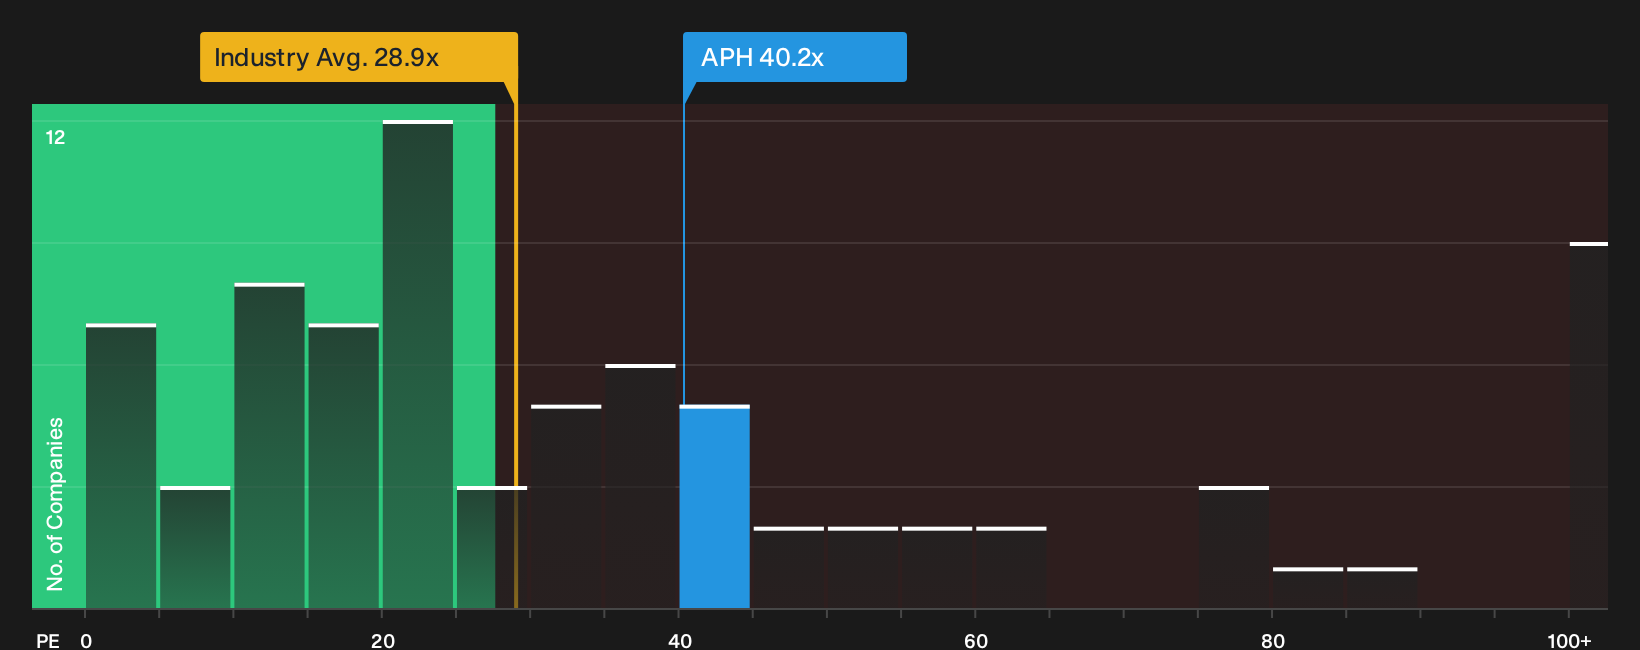
The first narrative leans heavily on fair value near $103.67, yet the market is also sending a different signal. Amphenol trades at a P/E of 40.2x, compared with 28.9x for the US Electronic industry and a fair ratio of 38.4x. This points to a richer price tag that could limit upside if expectations cool.
Peers on average sit far higher at 88x earnings, so the stock is not the most stretched in its group. However, the gap between 40.2x and the 38.4x fair ratio is a reminder that even a small shift in sentiment could matter a lot for anyone relying on further re-rating rather than earnings delivery.
For a closer look at how these P/E gaps stack up against industry averages and that fair ratio, and what they might signal about valuation risk for Amphenol, See what the numbers say about this price — find out in our valuation breakdown.
Next Steps
Mixed messages on Amphenol’s valuation story. If you want to move fast and judge the upside against the downside yourself, start with the 3 key rewards and 1 important warning sign.
Looking for more Amphenol style investment ideas?
Do not stop at Amphenol. If you want a broader watchlist that really works for you, use the Simply Wall Street Screener to surface fresh ideas before they move.
- Target resilient performers by tracking a 11 resilient stocks with low risk scores that aims to balance opportunity with tighter risk controls.
- Hunt for potential value candidates by scanning a 32 high quality undervalued stocks that filters for quality businesses priced below their assessed worth.
- Build a watchlist around income potential by focusing on a 6 dividend fortresses that screens for higher yields with supporting fundamentals.
This article by Simply Wall St is general in nature. We provide commentary based on historical data and analyst forecasts only using an unbiased methodology and our articles are not intended to be financial advice. It does not constitute a recommendation to buy or sell any stock, and does not take account of your objectives, or your financial situation. We aim to bring you long-term focused analysis driven by fundamental data. Note that our analysis may not factor in the latest price-sensitive company announcements or qualitative material. Simply Wall St has no position in any stocks mentioned.
Have feedback on this article? Concerned about the content? Get in touch with us directly. Alternatively, email editorial-team@simplywallst.com