
Exelon (EXC), Why Is Its Latest Update Drawing Fresh Attention?
Exelon (EXC) moved back into focus after reporting that its large-load and data center project pipeline had been cut from 43 GW to 36 GW following a review of customer funding commitments.
At a share price of US$43.16, Exelon has seen its short term momentum cool, with the 30 day share price return down 5.89% and the 90 day move lower by 6.54%. At the same time, the 1 year total shareholder return of 3.15% and 5 year total shareholder return of 45.02% point to a much stronger longer run outcome. This comes as the trimmed data center pipeline and reaffirmed investment plan have kept attention on how future growth projects are funded and sequenced.
Compare Exelon’s cooling momentum with other regulated utilities by scanning 39 power grid technology and infrastructure stocks to find companies that are positioned to benefit from heavy grid and data center investment pipelines.
Exelon now trades below recent highs after the pipeline reset and reaffirmed spending plan. This leaves a simple question hanging over the stock: Does the current price still skew the risk reward toward buyers, or not?
Most Popular Narrative: 12.5% Undervalued
Exelon’s most followed valuation narrative points to a fair value of $49.33 against the recent $43.16 share price, framing the current pullback as a discount that hinges on long term grid spending, regulatory outcomes, and data center driven load growth.
The significant identified pipeline ($10B–$15B) in future transmission projects, combined with proven success in competitive bidding, provides clear visibility for outsized capital investment prospects that are expected to increase the regulated asset base and deliver compounding earnings and cash flow growth.
Want to understand why this Exelon fair value leans on steady top line growth, slightly higher margins, and a future earnings multiple below the broader utilities sector? The narrative walks through how projected sales, profitability, and share count all feed into that 2029 earnings estimate and the implied valuation multiple. Curious which of those levers does the heavy lifting in the model and how sensitive the outcome is to even small tweaks in the assumptions? The full story connects those moving parts into one coherent pricing argument.
Result: Fair Value of $49.33 (UNDERVALUED)
Have a read of the narrative in full and understand what's behind the forecasts.
Still, that fair value story runs into trouble if regulators push back on rate recovery for Exelon’s US$41.7b capital plan or if rooftop solar adoption chips away at long term load growth.
Find out about the key risks to this Exelon narrative.
Another View: Exelon Through The Cash Flow Lens
The popular Exelon story leans on a US$49.33 fair value anchored in earnings and multiples. A very different picture comes out of the Simply Wall St DCF model, which pegs future cash flow value at just US$10.02. That points to Exelon trading well above this cash flow based estimate and raises a hard question. Which set of assumptions do you trust more when the gap is this wide?
Look into how the SWS DCF model arrives at its fair value.
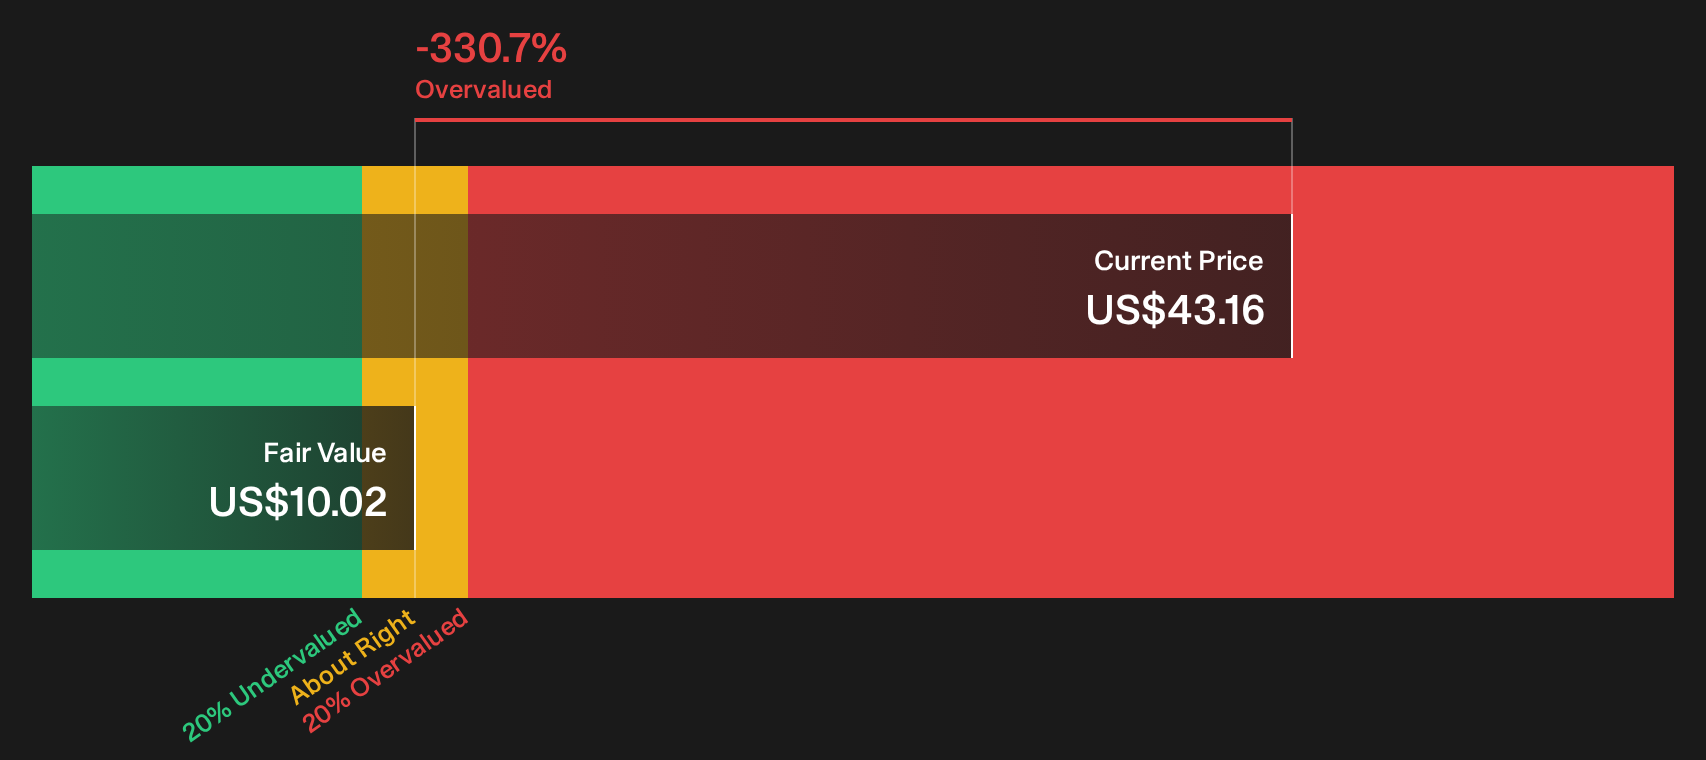
Simply Wall St performs a discounted cash flow (DCF) on every stock in the world every day (check out Exelon for example). We show the entire calculation in full. You can track the result in your watchlist or portfolio and be alerted when this changes, or use our stock screener to discover 32 high quality undervalued stocks. If you save a screener we even alert you when new companies match - so you never miss a potential opportunity.
Next Steps
Mixed signals around Exelon can be frustrating, so use that tension as a prompt to move quickly. Review the key data yourself and weigh both sides of the story with the help of our 4 key rewards and 2 important warning signs
Looking for more Exelon-sized opportunities?
If Exelon has sharpened your focus on quality, do not stop here. Use the Simply Wall St Screener to quickly surface other ideas that match your style.
- Target strong value setups by scanning 32 high quality undervalued stocks that combine disciplined pricing with solid underlying fundamentals.
- Build a steadier income stream by reviewing 6 dividend fortresses that aim to pair meaningful yields with resilient payout potential.
- Dial down portfolio volatility by filtering for 11 resilient stocks with low risk scores that score well on balance sheet strength and earnings stability.
This article by Simply Wall St is general in nature. We provide commentary based on historical data and analyst forecasts only using an unbiased methodology and our articles are not intended to be financial advice. It does not constitute a recommendation to buy or sell any stock, and does not take account of your objectives, or your financial situation. We aim to bring you long-term focused analysis driven by fundamental data. Note that our analysis may not factor in the latest price-sensitive company announcements or qualitative material. Simply Wall St has no position in any stocks mentioned.
Have feedback on this article? Concerned about the content? Get in touch with us directly. Alternatively, email editorial-team@simplywallst.com