
American Airlines (AAL) Stock’s Probability Curve Is Screaming for a Staggered Options Spread
On surface level, American Airlines (AAL) doesn’t look particularly appetizing. Since the beginning of the year, AAL stock is down more than 15%. More recently, its trailing one-month less comes out to roughly 14%, thereby triggering a 40% Sell rating from the Barchart Technical Opinion indicator.
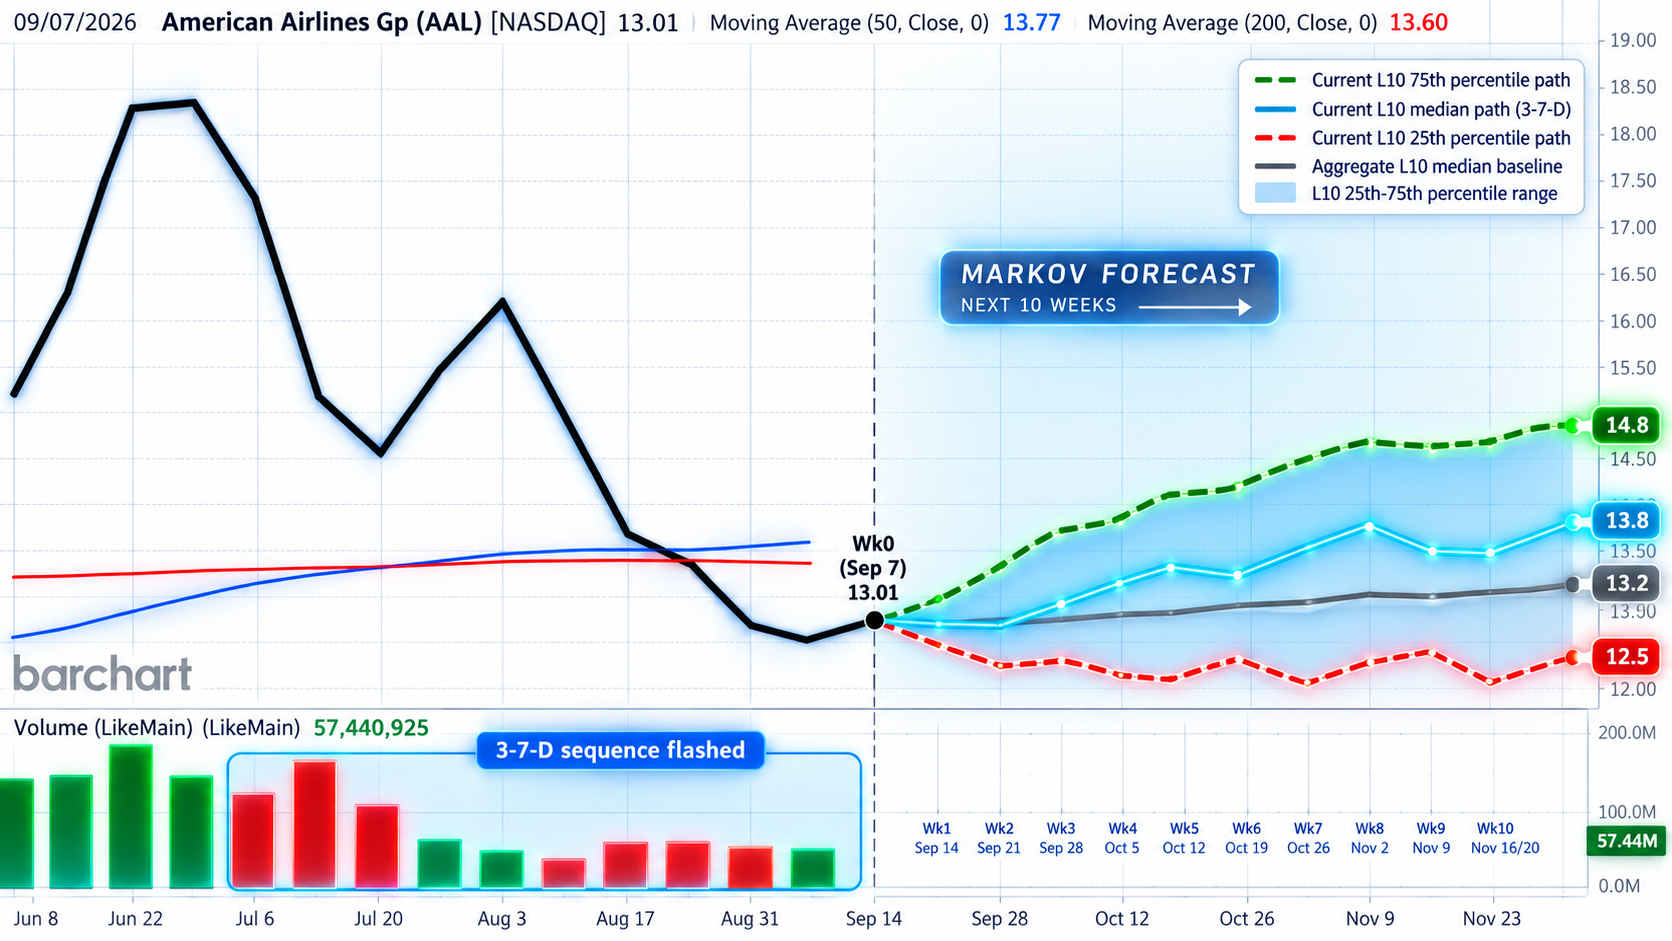
To make matters even worse, during the last 10 weekly candlesticks, 70% of the sessions were in the red, thereby leading to an overall downward slope across the total period. This 3-7-D (3 up, 7 down, downward slope) quantitative sequence ordinarily spells trouble. But the question isn’t so much about what the current snapshot is; rather, it’s what tends to happen after this signal flashes in the chart.
Based on data accumulated since January 2009, the facts of the matter show that whenever AAL stock is this bearish, the subsequent response over the next several weeks generally tends to be bullish. That may be because American Airlines — no matter how ugly the broader economy is — remains a relevant enterprise.
As such, observing market participants may be more enticed to consider picking up the discount, perhaps on the buy-the-dip, sell-the-rip sentiment. While it’s not the prettiest options trading idea out there, American Airlines stock may be worth a closer look, especially by sophisticated players.
A Common Presupposition for AAL Stock May Require Reexamination
From a simplified view, Wall Street’s options pricing mechanisms are focused on pricing risk based on a range of mathematical possibilities. Undergirding this framework is the basic presupposition that the target security — American Airlines stock, in this case — will undergo a random walk between now and the selected expiration date.
One consequence, though, of a random walk framework is that the future is independent of the past. In other words, no matter what transpired in the past — whether that be an extended rally or a prolonged corrective period — it has no bearing on tomorrow’s outcome.
Since the future is unknown, there is no such thing as the absolutely certain or correct presupposition. However, in my opinion, the equities market is nonrandom. Here, I believe that AAL stock will undergo a nonrandom walk over the next several weeks.
If so, the consequence is that the future is dependent on the past. And that’s the heart of the Markov chain, which asks, given the current state, what is the probability of transition to a future state? When it comes to equities, we don’t care so much about state-to-state transitions but the individual median fluctuations that occur within the projected future state.
Running a 3-Step Process to Analyze American Airlines Stock
In order to better effectively trade AAL stock, we need to start with an original presupposition. My hypothesis is that when American Airlines suffers a prolonged downturn, this behavioral state inspires buy-the-dip sentiments, thus resulting in a nonrandom, positive variance between the signal and the noise.
Specifically, we will execute three action items to empirically quantify our hypothesis:
- Signal: Identify the quant sequence (in this case, 3-7-D).
- State: Match the current sequence to identical sequences in the past.
- Probability: From these historical analogs, we calculate a likely range of forward outcomes.
Running this SSP framework going back to January 2009, we can identify 92 instances of the 3-7-D signal. Looking ahead to week 5 (which coincides with the Oct. 16 expiration date), we know that there is a 62% chance that American Airlines stock will hit the $13 price and a 38% chance that it will hit $14 on the aforementioned expiration date.
Granted, these success ratios may not sound all that enticing until you make the relative comparison. If we reverse-engineer Barchart’s Expected Move calculator — which provides a range of possibilities given a random walk framework — we can calculate the probability of AAL stock hitting $13 and $14 (at expiration) at 48.79% and 29.86%, respectively.
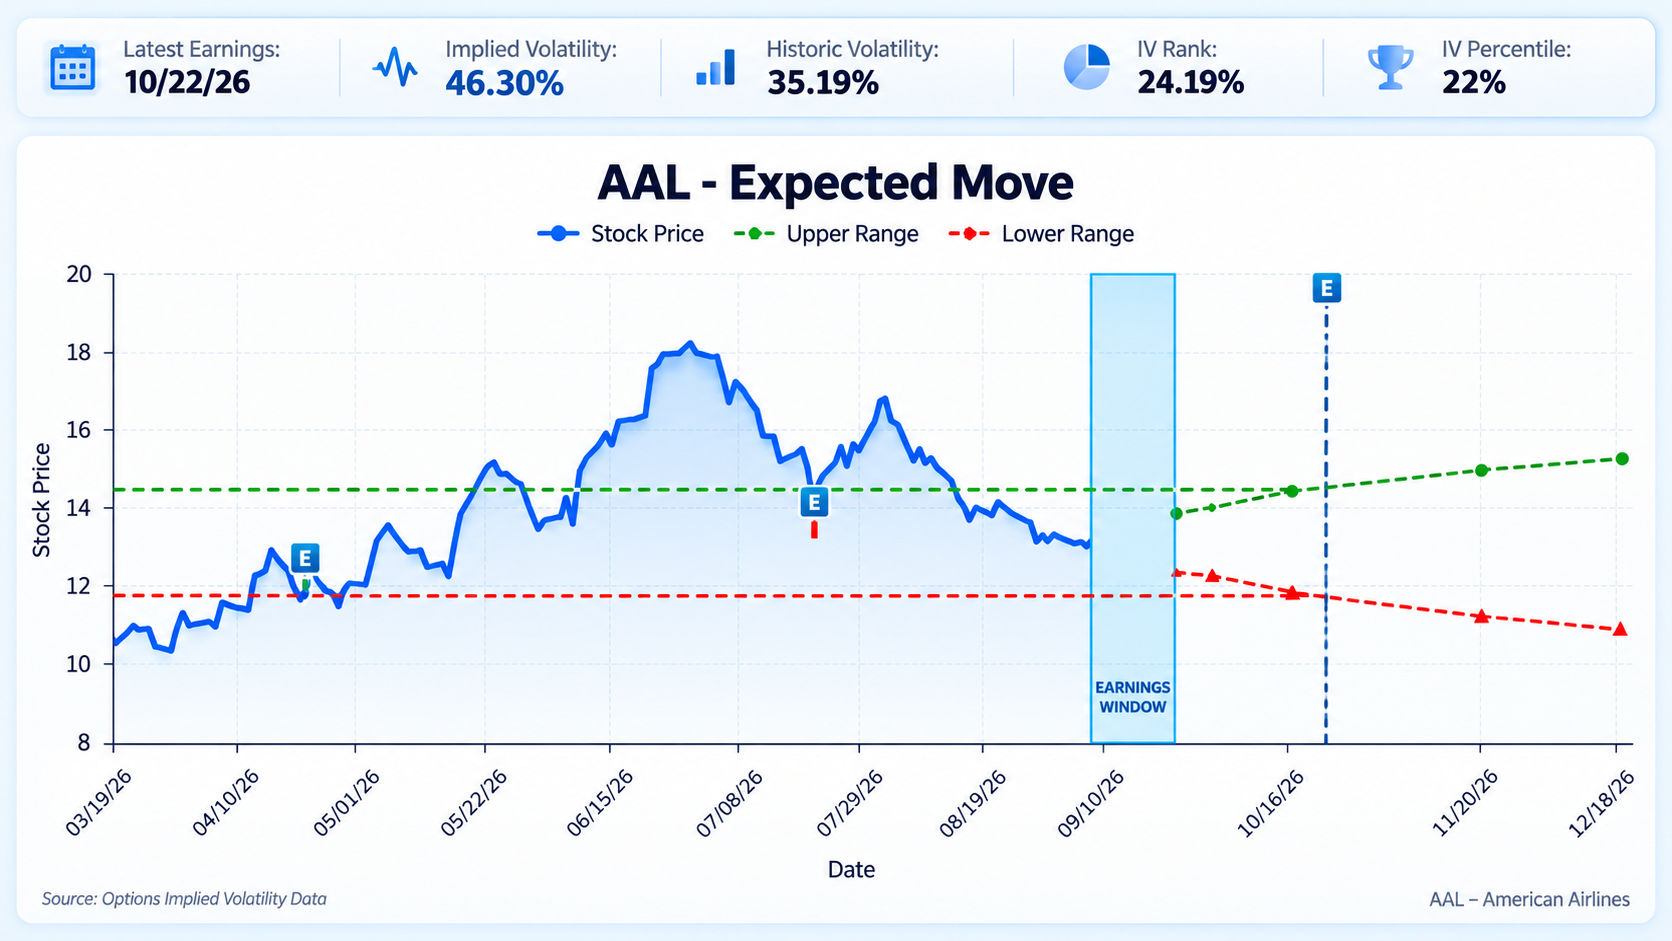
Suddenly, with the shift in presuppositions (from randomness to nonrandomess), our expected success ratios improve quite robustly.
Going for a Staggered Approach
Given that there appears to be a high probability of AAL stock landing at $13 and an aggressive but not completely unreasonable chance of hitting $14, a staggered approach may be interesting. One idea is to split the exposure, with 75% of the risk capital for this particular trade aiming for the reasonable $13 target and the rest of the 25% aiming for the speculative $14 target.
Going to Barchart’s screener for vertical spreads, we may consider the “reasonably safe” idea to be the 12/13 bull call spread (expiring Oct. 16) and the aggressive idea to be the 13/14 bull spread. For the former trade, the net debit required is $66 for the chance to generate a profit of $34, a maximum payout of roughly 52%. For the latter, the net debit is $40 for the chance to generate profit of $60, a max payout of 150%.
Obviously, the 13/14 spread features the much more attractive reward. However, the price you pay is the greater probabilistic risk. From Wall Street’s random walk presupposition, the odds are less than 30%. If you ran an expected value calculation, your portfolio would be projected to quickly sink.
Under a nonrandom walk assumption, the odds of success are still quite low. However, at 38%, it’s a more manageable risk — especially if you have staggered exposure to the safer 12/13 bull spread.
On the date of publication, Josh Enomoto did not have (either directly or indirectly) positions in any of the securities mentioned in this article. All information and data in this article is solely for informational purposes. For more information please view the Barchart Disclosure Policy here.