
Has Figma (FIG) Run Too Far Following Its Recent Rebound?
Figma (FIG) has drawn attention after its recent share performance, with the stock closing at US$23.20 and showing mixed short term returns that contrast with a stronger move over the past 3 months.
Recent trading paints a mixed picture for Figma, with the 1-day share price return of 4.79% and 90-day share price return of 29.03% contrasting with a year-to-date share price decline of 38.31% and a 1-year total shareholder return that is down 57.13%. This suggests that short term momentum has picked up while longer term holders are still under pressure.
Scan beyond Figma's rebound and line up other software names showing similar price dislocations with the hand picked 32 high quality undervalued stocks.
After a sharp 3 month bounce, long term returns for Figma are still deep in the red. The real question is whether the recent repricing has already done the heavy lifting, or if the current valuation still leaves meaningful upside on the table.
Most Popular Narrative: 4% Overvalued
On the most followed view of Figma, the fair value sits at $22.36, only slightly below the last close at $23.20. That small gap puts the focus less on mispricing and more on whether the existing business story can keep supporting the current tag.
A great product can still be an expensive stock. For now, I’m more confident in Figma’s competitive position, but I would want clearer operating leverage before becoming materially more optimistic about the valuation.
See why 63 investors see Figma as 4% overvalued.
Result: Fair Value of $22.36 (OVERVALUED)
Still, Figma faces two clear pressure points: intense competition in AI powered design tools and ongoing losses, with annual net income at a loss of US$1,526.79m.
Find out about the key risks to this Figma narrative.
Another View: Figma Through The Cash Flow Lens
A second take on Figma comes from the SWS DCF model, which estimates future cash flows back to today’s $23.20 share price. On this approach, FIG trades just below the DCF fair value of $23.25. This points to a stock that is very close to fully priced. The question is whether you trust that tight margin of safety.
Look into how the SWS DCF model arrives at its fair value.
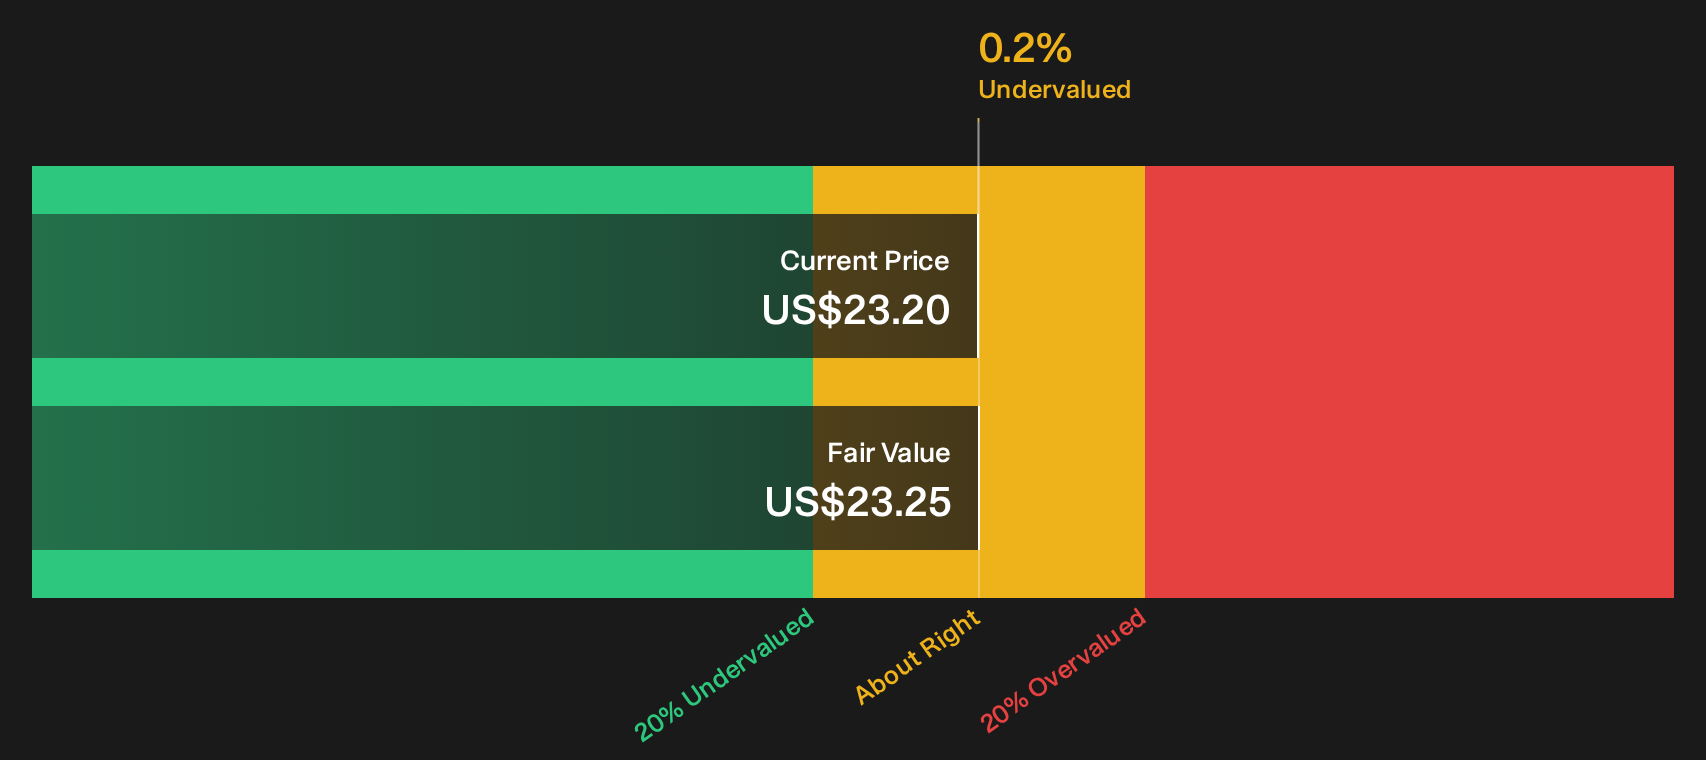
Simply Wall St performs a discounted cash flow (DCF) on every stock in the world every day (check out Figma for example). We show the entire calculation in full. You can track the result in your watchlist or portfolio and be alerted when this changes, or use our stock screener to discover 32 high quality undervalued stocks. If you save a screener we even alert you when new companies match - so you never miss a potential opportunity.
Next Steps
If the mixed mood around Figma leaves you on the fence, quickly review both sides of the story and weigh the 4 key rewards and 3 important warning signs.
Looking for more Figma investment ideas?
Do not stop at Figma. Broaden your watchlist with a few focused searches that surface fresh opportunities before they land on everyone else’s radar.
- Target higher income potential by scanning for companies with resilient payouts through the 6 dividend fortresses.
- Hunt for quality at a discount by reviewing the 15 high quality undiscovered gems that combine strong fundamentals with limited market attention.
- Reduce portfolio stress by filtering for defensiveness using the 11 resilient stocks with low risk scores that score well on resilience and downside protection.
This article by Simply Wall St is general in nature. We provide commentary based on historical data and analyst forecasts only using an unbiased methodology and our articles are not intended to be financial advice. It does not constitute a recommendation to buy or sell any stock, and does not take account of your objectives, or your financial situation. We aim to bring you long-term focused analysis driven by fundamental data. Note that our analysis may not factor in the latest price-sensitive company announcements or qualitative material. Simply Wall St has no position in any stocks mentioned.
Have feedback on this article? Concerned about the content? Get in touch with us directly. Alternatively, email editorial-team@simplywallst.com