
Is NSD (TSE:9759) Undervalued As Fresh Sales Growth Sharpens The Valuation Question?
NSD (TSE:9759) has put fresh numbers on the table, releasing preliminary unaudited sales for August 2026 that highlight year-on-year gains in both monthly and year-to-date net sales.
Against this sales update, NSD’s recent share price moves tell a mixed story for investors, with short term momentum reflected in a 17.8% 90 day share price return. However, the year to date share price is down 14.88% and the 5 year total shareholder return is 54.83%.
Compare NSD’s latest sales momentum with other software players by scanning a curated set of 74 high quality undiscovered gems that have strong fundamentals but still fly under most investors’ radar.
NSD has reported stronger sales while the share price remains down for the year. This raises a key question for investors: is there still meaningful upside available, or has most of the story already played out as the valuation picture becomes clearer?
Preferred P/E of 16.4x: Is it justified?
Valuation on NSD currently hinges on what investors are willing to pay for its earnings, with the stock trading on a P/E of 16.4x based on the latest figures and a last close of ¥2,895.
The P/E multiple compares the share price to earnings per share and, for an IT solutions provider like NSD, it effectively shows how much the market is paying today for each unit of profit. For businesses with steady earnings profiles, this ratio often reflects how confident investors are that current profits can be sustained or improved.
NSD is described as good value versus its own fundamentals, with a P/E of 16.4x compared with an estimated fair P/E of 19.4x. That gap suggests the valuation is lower than a level the market could move towards if the current earnings quality and growth trends remain intact in investors’ eyes.
Set against peers, the picture is more nuanced. The same 16.4x P/E is flagged as slightly expensive against the broader JP IT industry average of 16x, which means the stock trades at only a small premium to sector pricing while still looking cheaper than its own fair ratio benchmark.
Explore the SWS fair ratio for NSD.
Result: Price-to-earnings of 16.4x (UNDERVALUED)
Still, the recent share price decline over 2026 and pressure on IT spending could quickly challenge the current P/E story for NSD if contract activity softens.
Find out about the key risks to this NSD narrative.
Another view on NSD’s value
The SWS DCF model points in the same direction as the earnings multiple. At a share price of ¥2,895, NSD is compared with an estimated future cash flow value of ¥3,660.5, which suggests the stock is priced below what its cash generation might support.
The gap looks meaningful in practical terms. It gives investors a margin between the current quote and the modelled value, yet it also raises a simple question: How comfortable are you relying on cash flow assumptions when analyst forecasts are flagged as limited in depth?
Look into how the SWS DCF model arrives at its fair value.
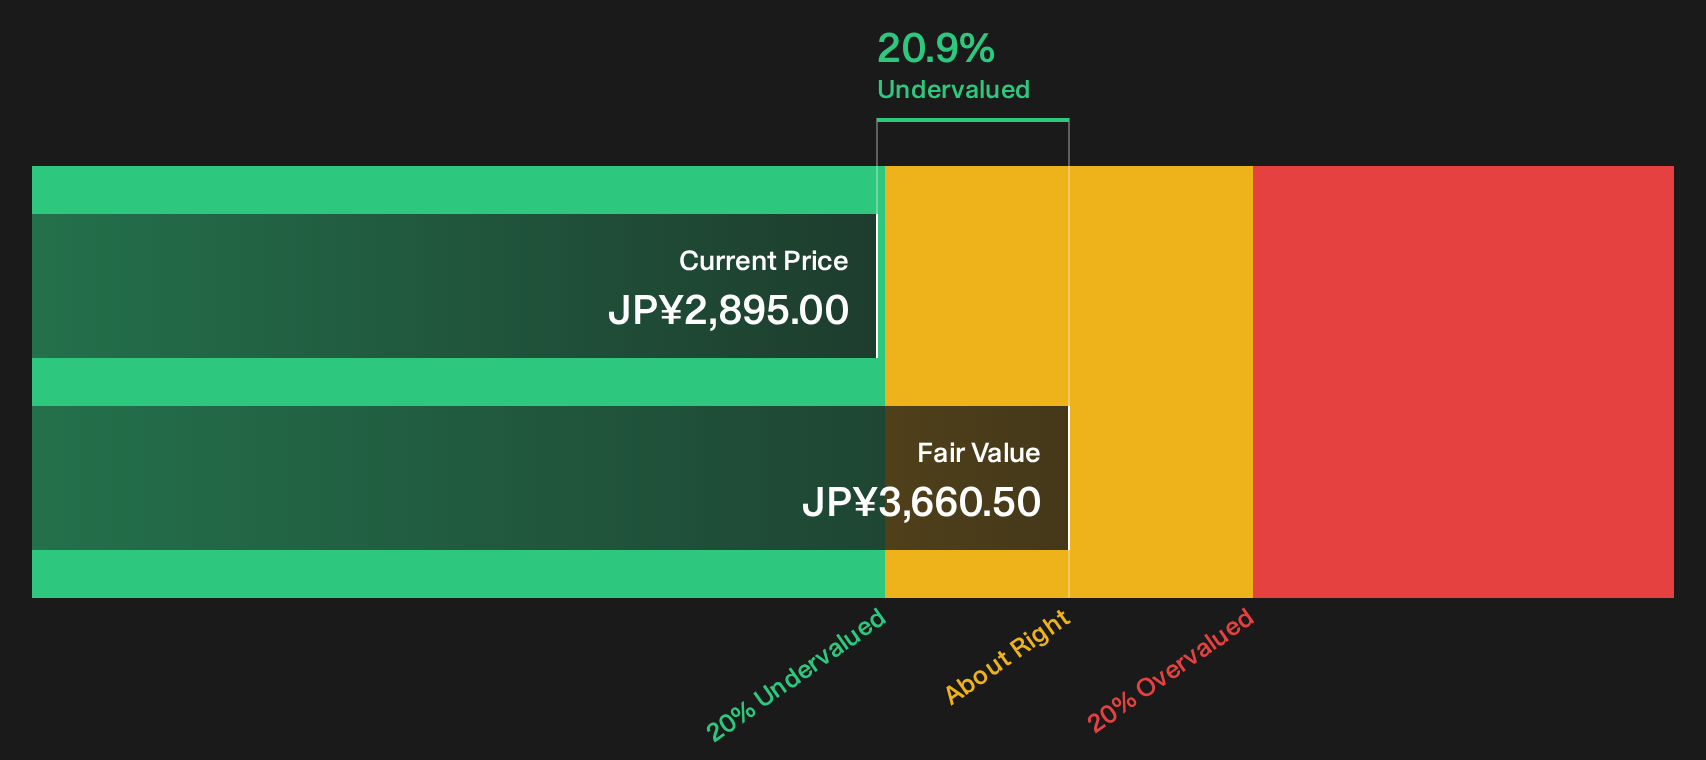
Simply Wall St performs a discounted cash flow (DCF) on every stock in the world every day (check out NSD for example). We show the entire calculation in full. You can track the result in your watchlist or portfolio and be alerted when this changes, or use our stock screener to discover 17 high quality undervalued stocks. If you save a screener we even alert you when new companies match - so you never miss a potential opportunity.
Next Steps
Sentiment around NSD’s valuation is mixed, so this is a moment to move quickly, test the assumptions against the raw numbers, and reach an independent view. To weigh those positives for yourself, start with the 4 key rewards
Looking for more investment ideas beyond NSD?
If NSD has caught your attention, this is the moment to widen your search and see what else the market is quietly offering on similar metrics.
- Spot potential value opportunities early by scanning a curated set of 17 high quality undervalued stocks that pair stronger fundamentals with cheaper pricing.
- Strengthen your focus on financial resilience by running through the list of solid balance sheet and fundamentals (19 results) and filtering for sturdier balance sheets and consistent fundamentals.
- Dial down risk and smooth out portfolio swings by reviewing the 12 resilient stocks with low risk scores that score well on stability while still offering room for potential growth.
This article by Simply Wall St is general in nature. We provide commentary based on historical data and analyst forecasts only using an unbiased methodology and our articles are not intended to be financial advice. It does not constitute a recommendation to buy or sell any stock, and does not take account of your objectives, or your financial situation. We aim to bring you long-term focused analysis driven by fundamental data. Note that our analysis may not factor in the latest price-sensitive company announcements or qualitative material. Simply Wall St has no position in any stocks mentioned.
Have feedback on this article? Concerned about the content? Get in touch with us directly. Alternatively, email editorial-team@simplywallst.com