
Has Aura Investments (TASE:AURA) Run Too Far Ahead Following Mixed 2026 Results?
Aura Investments (TASE:AURA) just posted mixed second quarter and first half 2026 results, reporting higher revenue but lower net income and earnings per share compared with the same periods last year.
Despite the mixed earnings, Aura Investments’ recent 30-day share price return of 19.13% points to improving short-term momentum, even as the year-to-date share price return is down 14.37% and the 1-year total shareholder return has declined 7.99%. This is set against very strong 3 and 5 year total shareholder returns of 133.16% and about 3.7x respectively.
Scan how Aura Investments compares with other property developers showing strong momentum and mixed earnings trends by reviewing the curated 188 high quality undervalued stocks.
The share price has just jumped while the intrinsic value estimate still sits below the market, creating a wide band between recent enthusiasm and valuation models. Where does Aura Investments’ fair value really land within that range?
Price-to-Earnings of 20.3x: Is it justified?
Aura Investments closed at ₪17.87 while trading on a P/E of 20.3x, which places the stock on a richer earnings multiple than the broader IL real estate sector.
The P/E ratio compares what you pay per share to the profits the business generates per share. For a residential developer like Aura Investments, this metric often reflects how much investors are willing to pay today for current earnings, given the project pipeline, risk profile, and balance sheet.
Recent data shows earnings contracted by 6.1% over the past year and net profit margins sit at 11.4%, down from 15.1%. Against that backdrop, a 20.3x P/E indicates that the market is assigning a relatively optimistic earnings profile even though interest payments are not well covered by profits and all reported liabilities come from higher risk borrowing rather than customer deposits.
Compared with the IL real estate industry average P/E of 13.4x, Aura Investments trades on a much fuller valuation. Yet against a peer group average P/E of 20.4x, the shares line up almost exactly with similar sized rivals, suggesting investors are assigning Aura Investments a valuation that is broadly in line with close comparables rather than the wider sector.
See what the numbers say about this price — find out in our valuation breakdown.
Result: Price-to-Earnings of 20.3x
Still, Aura Investments carries clear pressure points, including interest costs that strain profit coverage and a capital structure tilted toward higher risk borrowing rather than customer deposits.
Find out about the key risks to this Aura Investments narrative.
Another View on Aura Investments’ Value
The SWS DCF model paints a much harsher picture than the earnings multiple. At ₪17.87, Aura Investments trades far above an estimated future cash flow value of ₪1.73, which points to a stock that screens as heavily overvalued on this method. How much weight should you give to a cash flow model that is far out of line with the market price?
Look into how the SWS DCF model arrives at its fair value.
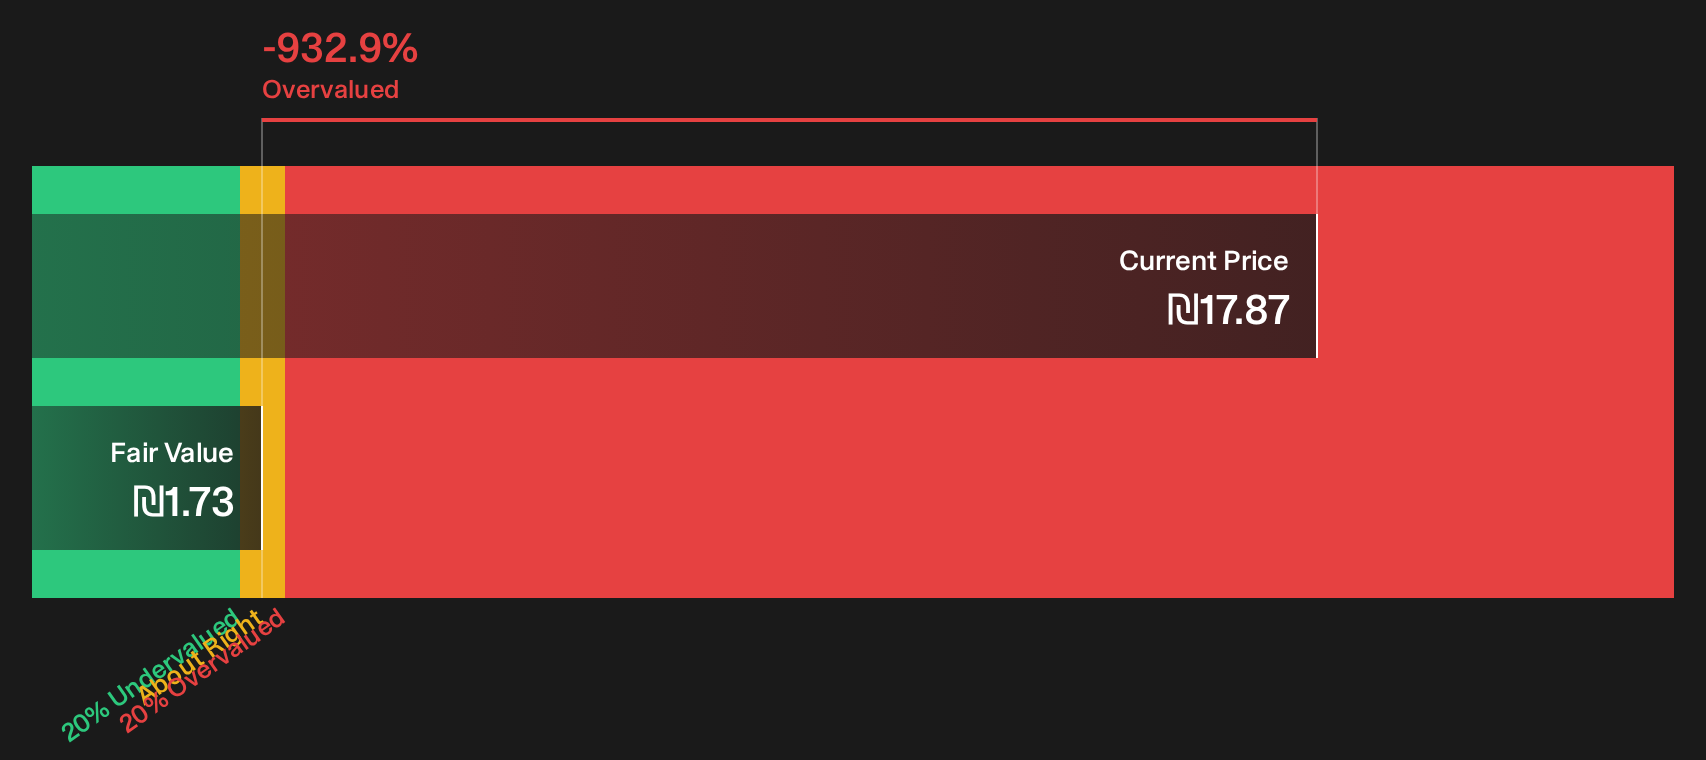
Simply Wall St performs a discounted cash flow (DCF) on every stock in the world every day (check out Aura Investments for example). We show the entire calculation in full. You can track the result in your watchlist or portfolio and be alerted when this changes, or use our stock screener to discover 188 high quality undervalued stocks. If you save a screener we even alert you when new companies match - so you never miss a potential opportunity.
Next Steps
Mixed messages on Aura Investments can easily pull you in opposite directions, so spend a few minutes with the numbers yourself and decide where you stand. To put those figures in context, review the 3 important warning signs
Looking for more investment ideas beyond Aura Investments?
If Aura Investments has you thinking more carefully about price, risk, and balance sheet strength, it makes sense to widen your watchlist with targeted ideas.
- Zero in on resilient companies with strong finances by scanning the list of solid balance sheet and fundamentals (194 results) that filters for sturdier balance sheets and solid fundamentals.
- Hunt for potential mispricings by reviewing the 616 high quality undiscovered gems that highlight quality businesses the market may not be fully focusing on yet.
- Focus on steadier return profiles through the 103 resilient stocks with low risk scores that flags stocks with lower risk scores and more defensible positions.
This article by Simply Wall St is general in nature. We provide commentary based on historical data and analyst forecasts only using an unbiased methodology and our articles are not intended to be financial advice. It does not constitute a recommendation to buy or sell any stock, and does not take account of your objectives, or your financial situation. We aim to bring you long-term focused analysis driven by fundamental data. Note that our analysis may not factor in the latest price-sensitive company announcements or qualitative material. Simply Wall St has no position in any stocks mentioned.
Have feedback on this article? Concerned about the content? Get in touch with us directly. Alternatively, email editorial-team@simplywallst.com