
Hong Kong and China Gas (SEHK:3) Draws Valuation Focus, Is The Premium Already Too High?
Hong Kong and China Gas (SEHK:3) recently drew investor attention after fresh performance figures showed modest revenue and net income growth, along with total returns that differ sharply between the past 3 years and the longer 5 year period.
Recent trading has been mixed for Hong Kong and China Gas, with the 30-day share price return of 5.19% and 90-day gain of 5.74% contrasting with a year-to-date share price move that is roughly flat. The 3-year total shareholder return of 50.33% points to stronger momentum over a longer stretch, despite a 5-year total shareholder return that declined 24.87%.
Scan beyond Hong Kong and China Gas and compare its recent performance with a hand-picked 103 resilient stocks with low risk scores that have shown resilience when returns diverge across different time frames.
Recent gains and a mixed 3 year and 5 year track record put Hong Kong and China Gas in an awkward spot for timing. Does it make more sense to commit now or wait for a cheaper entry before the valuation case stacks up?
Price-to-Earnings of 20.8x: Is it justified?
Valuation on Hong Kong and China Gas looks tight, with the stock trading on a P/E of 20.8x, which implies investors are paying a premium at the current last close of HK$7.10 for each dollar of reported profit.
The P/E ratio compares the share price to earnings per share and is a common way to judge how much the market is willing to pay for a utility's profits. For a business like Hong Kong and China Gas, which shows annual revenue growth of 1.2% and earnings growth of 2.6% based on forecasts, a high P/E often signals that the market is already pricing in steady, rather than rapid, improvement.
Here, the tension is between recent progress and valuation. Earnings grew 12.9% over the past year, net profit margins improved from 10.2% to 11.3%, and profits have inched higher at 1.4% per year over five years. Yet the current P/E of 20.8x is well above the estimated fair P/E of 9.8x. This points to a level the market could plausibly move toward if expectations cool or results fall short.
The premium is even clearer when stacked against peers. Hong Kong and China Gas trades on 20.8x earnings compared with 8.6x for its peer group and 13.8x for the wider Asian Gas Utilities industry, which is a materially richer valuation than both the sector and the fair P/E estimate.
Explore the SWS fair ratio for Hong Kong and China Gas.
Result: Price-to-Earnings of 20.8x (OVERVALUED)
Still, Hong Kong and China Gas relies heavily on Mainland China revenue and carries a richer P/E than peers, so any earnings disappointment could pressure that premium quickly.
Find out about the key risks to this Hong Kong and China Gas narrative.
Another view on Hong Kong and China Gas valuation
While the P/E comparison paints Hong Kong and China Gas as expensive, the SWS DCF model is more restrained. At a current share price of HK$7.10 against an estimated future cash flow value of HK$6.58, the stock screens as overvalued on this framework too. So where does that leave your margin of safety?
Look into how the SWS DCF model arrives at its fair value.
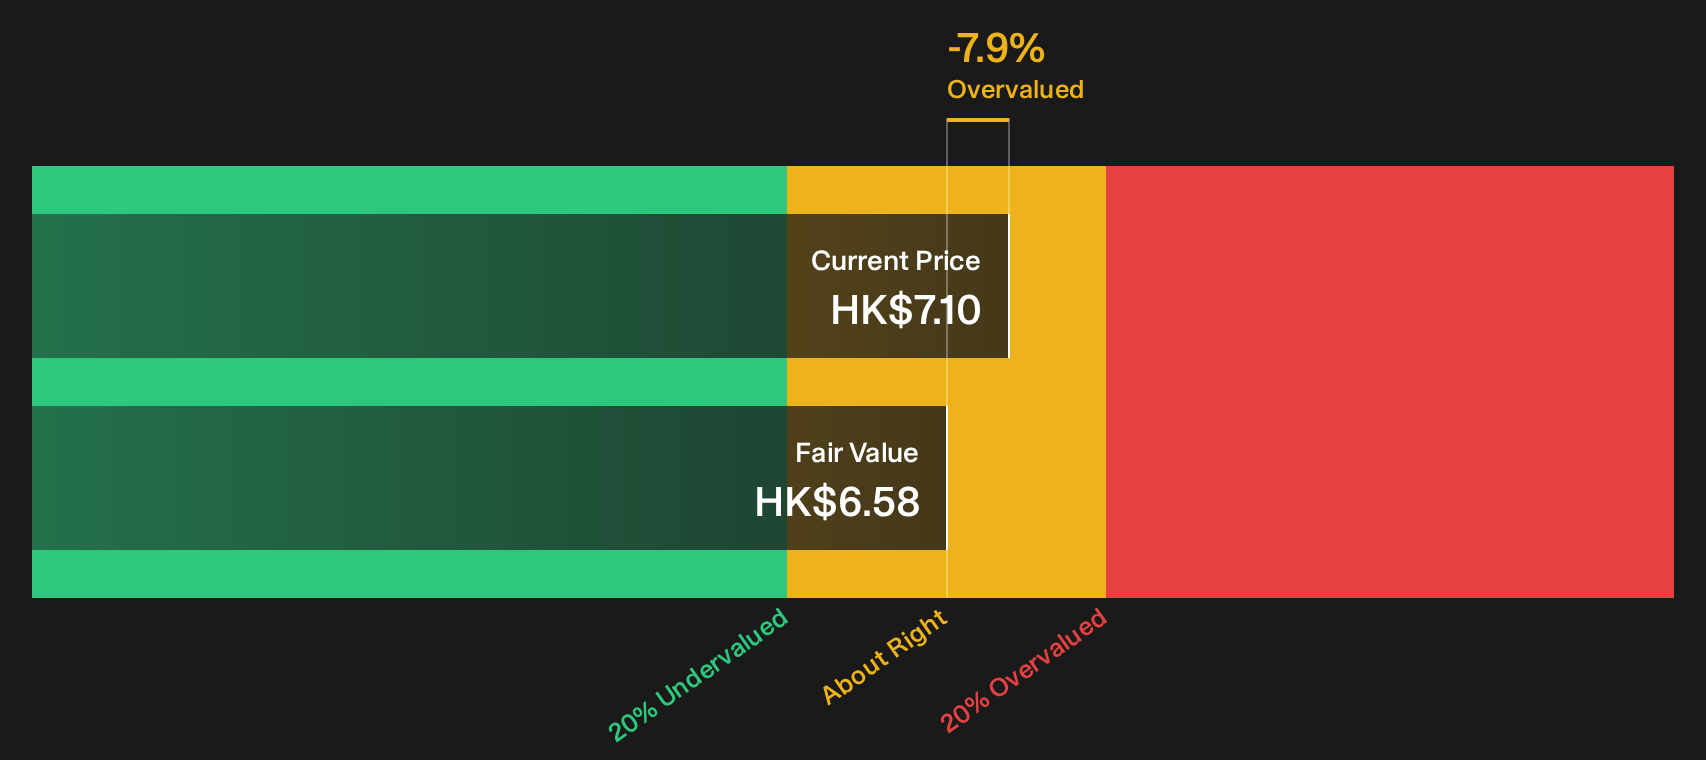
Simply Wall St performs a discounted cash flow (DCF) on every stock in the world every day (check out Hong Kong and China Gas for example). We show the entire calculation in full. You can track the result in your watchlist or portfolio and be alerted when this changes, or use our stock screener to discover 190 high quality undervalued stocks. If you save a screener we even alert you when new companies match - so you never miss a potential opportunity.
Next Steps
Sentiment on Hong Kong and China Gas is clearly split, with risks on one side and rewards on the other. Move fast and stress test the data yourself before the crowd settles on a view. To see how that balance currently looks in one place, start with 1 key reward and 2 important warning signs
Looking for more investment ideas beyond Hong Kong and China Gas?
If Hong Kong and China Gas feels finely balanced, broaden your watchlist now and give yourself more options before the next big move catches you off guard.
- Target resilience first and cut portfolio stress by focusing on 103 resilient stocks with low risk scores, which aim to keep volatility in check when conditions change.
- Hunt for value opportunities with healthy fundamentals by scanning 190 high quality undervalued stocks, which may trade below what their financial strength suggests.
- Strengthen your income stream and assess payout reliability with 162 dividend fortresses, which combine yield with more robust balance sheets.
This article by Simply Wall St is general in nature. We provide commentary based on historical data and analyst forecasts only using an unbiased methodology and our articles are not intended to be financial advice. It does not constitute a recommendation to buy or sell any stock, and does not take account of your objectives, or your financial situation. We aim to bring you long-term focused analysis driven by fundamental data. Note that our analysis may not factor in the latest price-sensitive company announcements or qualitative material. Simply Wall St has no position in any stocks mentioned.
Have feedback on this article? Concerned about the content? Get in touch with us directly. Alternatively, email editorial-team@simplywallst.com