
Skylark Holdings (TSE:3197) Posts Strong August Sales, Is The Valuation Already Too Rich?
Sales update puts Skylark Holdings in focus
Skylark Holdings (TSE:3197) landed back on investor radar after reporting August 2026 all-store sales of 107.2% and same-store sales of 104.6%, with year to date figures at 108.4% and 106.1%.
The fresh trading statement gives you a current snapshot of how the restaurant operator’s outlets are performing across Japan and sets a reference point for thinking about Skylark Holdings alongside recent share price moves.
Recent trading has been choppy. The share price slipped 3.3% over the past week but still shows a 21.3% gain over 90 days. The 1-year total shareholder return of 10.6% and 5-year total shareholder return of 114.5% point to stronger longer term momentum for Skylark Holdings.
Compare Skylark Holdings’ sales momentum with other consumer businesses showing strong fundamentals using our hand picked list of solid balance sheet and fundamentals (19 results) for a broader view of opportunities in this corner of the market.
Bulls point to Skylark Holdings’ sales traction and long term returns. Bears highlight the recent pullback and a share price above some valuation estimates. As you weigh the valuation next, consider which side the numbers sit closer to.
Price-to-earnings of 39.7x for Skylark Holdings: Is it justified?
On the latest numbers, Skylark Holdings changes hands at a P/E of 39.7x, which places the stock at a richer valuation than both its peer group and the broader JP Hospitality sector based on current earnings.
The P/E ratio compares the share price with earnings per share. For restaurant operators like Skylark Holdings, this metric often reflects how much investors are willing to pay today for each unit of current profit, given expectations for future growth, brand strength and competitive position.
Here, the market is assigning Skylark Holdings a P/E of 39.7x. The peer average sits at 32.5x and the JP Hospitality industry average sits at 21.9x. That represents a substantial premium, especially when set against an estimated fair P/E of 26x that our valuation checks point to as a level the market could move towards if sentiment or growth expectations cool.
Explore the SWS fair ratio for Skylark Holdings.
Result: Price-to-earnings of 39.7x (OVERVALUED)
Still, a share price above the ¥3,080 analyst target and a P/E near 40x leaves Skylark Holdings exposed if earnings or sales momentum disappoint.
Find out about the key risks to this Skylark Holdings narrative.
Another view on Skylark Holdings valuation
The high P/E paints Skylark Holdings as expensive, yet the SWS DCF model points in the opposite direction. On that framework, the shares trade around 8.7% below an estimated fair value of ¥3,637.33, which frames today’s price as a potential discount rather than a premium.
Look into how the SWS DCF model arrives at its fair value.
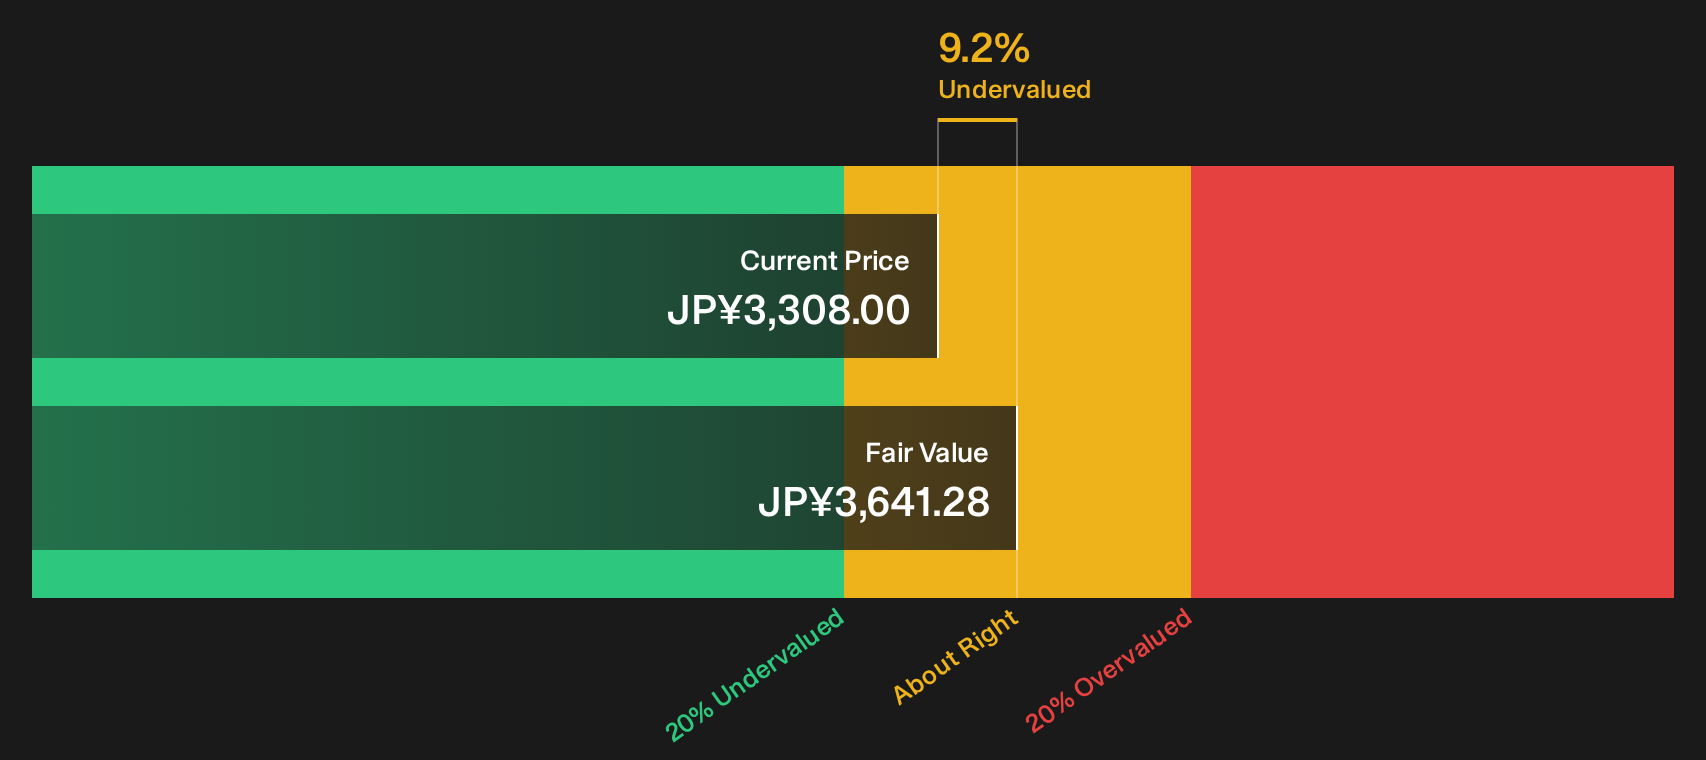
Two methods, two different answers. When one metric says overvalued and another flags undervalued, which signal do you find more useful for your own process?
Simply Wall St performs a discounted cash flow (DCF) on every stock in the world every day (check out Skylark Holdings for example). We show the entire calculation in full. You can track the result in your watchlist or portfolio and be alerted when this changes, or use our stock screener to discover 17 high quality undervalued stocks. If you save a screener we even alert you when new companies match - so you never miss a potential opportunity.
Next Steps
Mixed messages on value and risk can be useful if they push you to check the detail yourself and decide where you stand. To see the key issues investors are weighing up on Skylark Holdings right now, review the 3 key rewards and 1 important warning sign.
Looking for more investment ideas beyond Skylark Holdings?
If Skylark Holdings has you thinking more broadly about where to put fresh capital, do not stop at a single ticker. Use this moment to line up a shortlist of alternatives that match your risk level, income needs and return goals.
- Target reliable income streams by scanning companies with strong dividend profiles using our 18 dividend fortresses.
- Hunt for quality at a discount through the 17 high quality undervalued stocks that filters for resilient balance sheets and solid cash generation.
- Prioritise capital protection first by reviewing our 12 resilient stocks with low risk scores that focuses on businesses with lower risk scores and steadier fundamentals.
This article by Simply Wall St is general in nature. We provide commentary based on historical data and analyst forecasts only using an unbiased methodology and our articles are not intended to be financial advice. It does not constitute a recommendation to buy or sell any stock, and does not take account of your objectives, or your financial situation. We aim to bring you long-term focused analysis driven by fundamental data. Note that our analysis may not factor in the latest price-sensitive company announcements or qualitative material. Simply Wall St has no position in any stocks mentioned.
Have feedback on this article? Concerned about the content? Get in touch with us directly. Alternatively, email editorial-team@simplywallst.com