
Is Luxempart (BDL:LXMPR) Stock Mispricing Its 93.8% Net Margin?
Luxempart’s share price went nowhere into this earnings release, remaining flat over the past week and slightly weaker over one and three months. Yet the latest figures show a very different story. Trailing 12 month earnings are very large compared with the prior year and net margins sit at 93.8%, while the stock trades on a P/E of 5.3x against much richer peer and sector multiples. The market is treating this as a ho hum holding, but the combination of high profitability and a compressed valuation is where the real tension sits today.
Is Luxempart a discounted cash machine, or a trap created by one exceptional year of earnings and a low P/E multiple? Compare the market price with fair value in the full valuation analysis for Luxempart
H1 2026 Luxempart Earnings Summary
- Revenue (H1 2026 vs. H1 2025): €91.6 million vs. €71.2 million (up about 29%)
- Net Income (H1 2026 vs. H1 2025): €82.3 million vs. €62.9 million (up about 31%)
- Basic EPS (H1 2026 vs. H1 2025): €4.08 per share vs. €3.12 per share (up about 31%)
- Net Margin (Trailing 12 Months vs. Prior Year): 93.8% vs. 78.5% (higher profitability on recent earnings)
Prefer clean, visual charts instead of pages of earnings tables and footnotes. See Luxempart’s full financial picture with a clear view of its valuation at a glance in the company report for Luxempart.
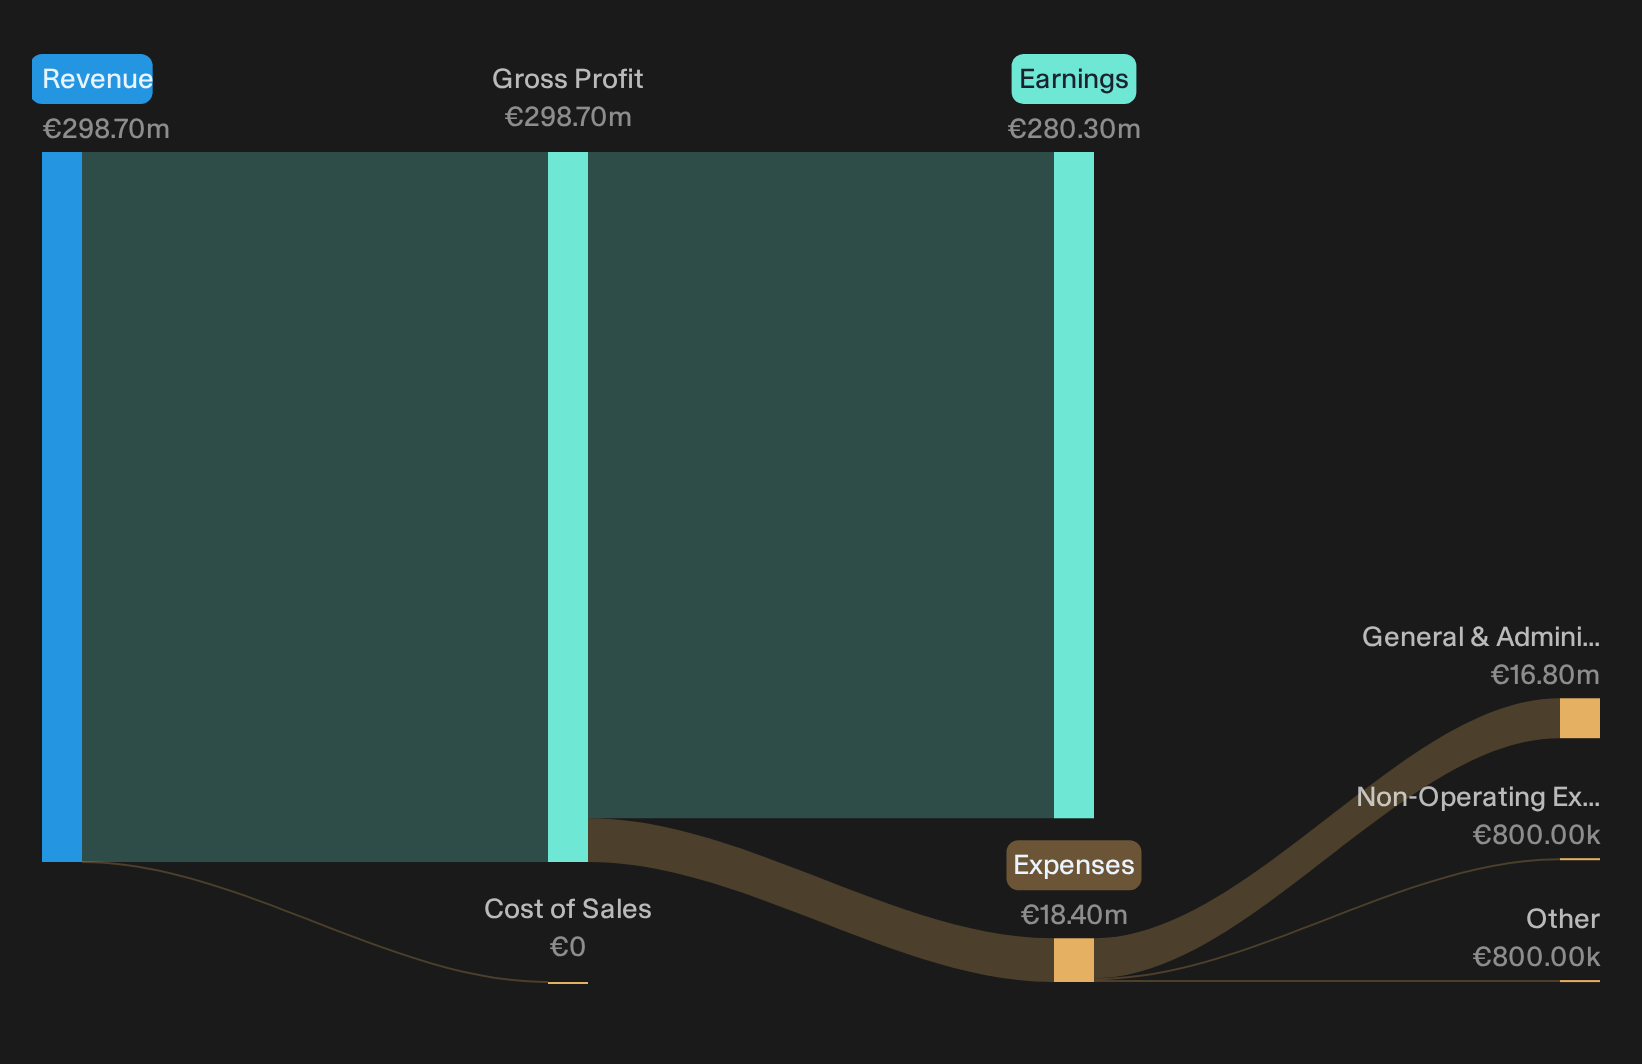
Luxempart earnings lend weight to bullish story
For anyone leaning positive on Luxempart, these numbers help. Revenue for H1 2026 is higher than H1 2025 and net income moves in the same direction, so the model is at least pulling in more cash, not less. Earnings per share tracks that trend, which matters because it shows benefits flowing to you rather than just sitting in the structure. A 93.8% trailing net margin is extreme for an investment holding business and signals that recent exits and revaluations are still feeding strongly into reported profitability.
Short term share drift keeps bearish worries alive
Yet the share price tells a different story. Flat over 7 days and weaker over 1 and 3 months, the stock has not followed the earnings direction. That gap feeds familiar concerns about look through complexity, liquidity and the risk that a very strong year of gains is hard to repeat. For a listed investment group like Luxempart, that lag between portfolio income and market pricing is exactly where worries about a sticky discount to underlying value tend to cluster.
Compare Luxempart’s strong recent profitability with what institutional analysts are signaling on the upside and downside. See the consensus price target analysis for Luxempart to check whether the Street thinks this earnings profile supports the current €73.5 share price or points somewhere very different.Take Charge Of Your Next Move
If Luxempart’s mix of high recent profitability and a low P/E has your attention, register for free with Simply Wall St and add it to a Watchlist so you can track the share price against fair value and wait for your preferred entry point. After you commit capital, keep the signal clear and the noise filtered with the Portfolio Command Center that highlights only material changes to your holdings. For long term planning, lean on the breadth of views inside the Community to see how other investors are interpreting the same numbers. Spot potential catalysts and emerging risks early so you can act before the wider market fully reacts.
Seeking Alternatives Beyond Luxempart?
Fresh ideas move first when momentum builds and quiet opportunities start flying before most investors even glance their way. Check these curated lists under the radar for now and act now.
- Spot resilient compounders before they hit every headline by scanning a curated 102 resilient stocks with low risk scores that still show room to move while it matters.
- Ride potential earnings breakouts by zeroing in on 75 profitable AI stocks that aren't just burning cash that already generate cash instead of burning it while that edge is still yours.
- Lock in income ideas that others overlook by filtering for 161 dividend fortresses while yields remain elevated and prices have not fully caught the shift.
This article by Simply Wall St is general in nature. We provide commentary based on historical data and analyst forecasts only using an unbiased methodology and our articles are not intended to be financial advice. It does not constitute a recommendation to buy or sell any stock, and does not take account of your objectives, or your financial situation. We aim to bring you long-term focused analysis driven by fundamental data. Note that our analysis may not factor in the latest price-sensitive company announcements or qualitative material. Simply Wall St has no position in any stocks mentioned.
Have feedback on this article? Concerned about the content? Get in touch with us directly. Alternatively, email editorial-team@simplywallst.com