
Brown & Brown (BRO) Stock Still Looks Rich On Its Earnings Profile
Brown & Brown has seen its share price under pressure, and that naturally raises the question of whether the current valuation still lines up with what its earnings can support. For investors who follow Brown & Brown closely, the key issue now is how much the recent share price slide has already been reflected in its profit profile.
- Over the past year the stock has fallen 25.3%, which puts the focus squarely on whether that drop has brought the valuation into closer alignment with its earnings power.
- The business model relies heavily on fee and commission income, so the quality and consistency of those earnings can shape how much investors are willing to pay for each dollar of profit.
- There is a second opinion on Brown & Brown worth weighing. See what analysts think Brown & Brown's shares could be worth.
The issue now is whether Brown & Brown's current share price is justified by the earnings it is generating today and is expected to produce over time.
If you want to see how Brown & Brown compares with other opportunities that are screened on valuation grounds, a focused starting point is 34 high quality undervalued stocks.
Is Brown & Brown Getting Expensive on Earnings?
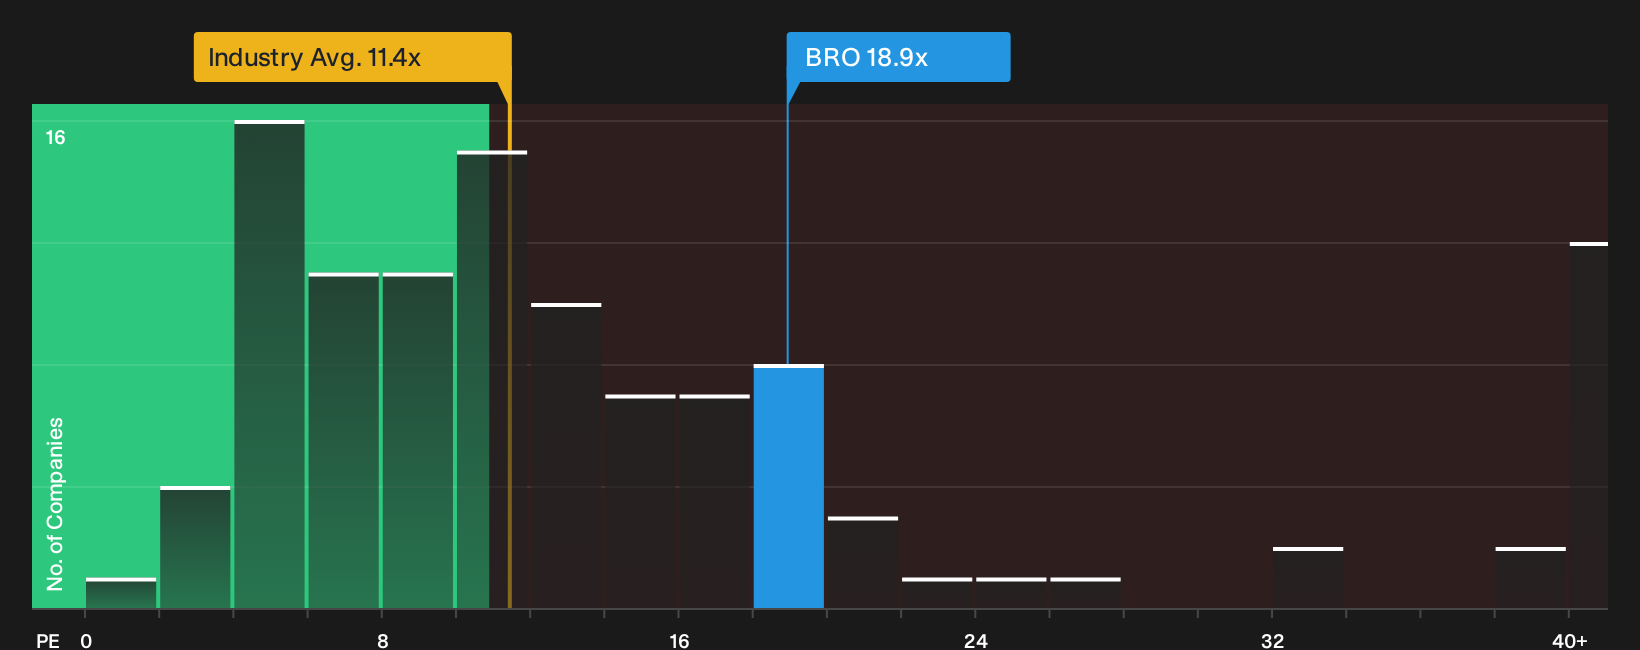
The P/E ratio suits Brown & Brown because earnings are a central anchor for how investors usually judge insurance brokers. On this measure, the stock trades on about 18.9x, compared with an Insurance sector average of roughly 11.4x and a broader peer group closer to 31.1x. That leaves Brown & Brown priced above the typical insurer but below many listed peers in the space.
The tailored fair multiple implied by its fundamentals sits below the current 18.9x level. This points to the shares screening as overvalued on this model even after the recent pullback. For you as a holder or potential buyer, the question is whether Brown & Brown's earnings profile and risk mix are strong enough to justify paying more than this customised benchmark and a clear premium to the sector. Explore the numbers behind Brown & Brown's P/E valuation.
The Brown & Brown Narrative: What Would Justify Today's Price?
Simply Wall St Narratives pick up where the Brown & Brown valuation puzzle leaves off by spelling out which future paths for growth, margins and earnings would need to hold for the stock to look meaningfully cheaper or richer than today’s price, and they sit on the company’s Community page. Rather than relying on a single multiple or model output, each narrative lays out the key assumptions behind its view of fair value so you can compare them with actual results as they arrive.
One of the top community narratives on Brown & Brown: 11% undervalued
"Strong cash flow from operations, combined with a strategic focus on leveraging a diversified portfolio across geographies and lines of business..."
Discover why this Narrative puts Brown & Brown at 11% undervalued.
For Brown & Brown, the share price is only half the story
Before you treat Brown & Brown's current valuation as the full picture, it is worth asking who is steering the business, how they are rewarded, and whether those incentives line up with your priorities. See who runs Brown & Brown and how they are paid.
This article by Simply Wall St is general in nature. We provide commentary based on historical data and analyst forecasts only using an unbiased methodology and our articles are not intended to be financial advice. It does not constitute a recommendation to buy or sell any stock, and does not take account of your objectives, or your financial situation. We aim to bring you long-term focused analysis driven by fundamental data. Note that our analysis may not factor in the latest price-sensitive company announcements or qualitative material. Simply Wall St has no position in any stocks mentioned.
Have feedback on this article? Concerned about the content? Get in touch with us directly. Alternatively, email editorial-team@simplywallst.com