
Is Replimune Group (REPL) Fully Valued Following Its RP1 Class Action News?
Replimune Group (REPL) is back in focus after a pending securities class action highlighted investor concerns around its RP1 regulatory approach, even as the biotech prepares to present at a major healthcare conference in New York.
At a share price of US$13.03, Replimune Group has seen the 7 day share price return fall 11.78% and the 30 day share price return decline 12.96%. However, the 90 day share price return of 30.30% and 1 year total shareholder return of 125.04% point to momentum that built sharply before the class action headlines began to reshape how investors view risk around RP1.
Compare Replimune Group’s legal overhang and recent momentum with a curated 11 resilient stocks with low risk scores that some investors use when they want steadier stories alongside higher-volatility biotech names.
After a 1 year total shareholder return above 100% and a sharp pullback around the RP1 lawsuit, Replimune Group now sits at an awkward crossroads. Is most of the easy upside already spent, or is valuation still behind the story?
Preferred Price-to-Book of 11.6x: Is it justified for Replimune Group?
On simple valuation checks, Replimune Group does not look cheap, with a price-to-book ratio of 11.6x compared with 2.3x for the broader US biotech industry and 3.5x for its direct peer set. That gap sits alongside the SWS DCF model output, which suggests the shares trade at an 89.9% discount to an estimated future cash flow value of $129.48. Readers are therefore looking at two very different signals next to a last close of $13.03.
The price-to-book multiple compares the market value of the equity with the accounting value of net assets. For an early-stage biotech like Replimune Group, most of the potential sits in RP1, RP2 and the oncolytic immunotherapy platform, which are not fully captured on the balance sheet. As a result, the market often pays a premium to book value when it expects those assets to matter over time.
That said, the current ratio is almost 5x the wider biotech average and more than 3x the peer group. This indicates investors are paying up heavily relative to the sector for a business that is still loss-making, reports $0 in revenue, and is not forecast to achieve profitability over the next three years. This rich P/B level suggests the market is pricing in strong future progress and successful execution on its pipeline, even as the RP1 lawsuit, ongoing losses of $297.0m and reliance on higher risk external funding sources introduce clear uncertainties that readers should weigh carefully.
See what the numbers say about this price — find out in our valuation breakdown.
Result: Price-to-book of 11.6x (OVERVALUED)
Still, the RP1 lawsuit and ongoing losses of $297.0m each year could quickly challenge the premium that investors are currently willing to pay for Replimune Group.
Find out about the key risks to this Replimune Group narrative.
Another View on Replimune Group’s Value
The earlier discussion painted Replimune Group as expensive on a P/B of 11.6x. The SWS DCF model tells a very different story, indicating the stock trades at an 89.9% discount to an estimated future cash flow value of $129.48 per share. Which signal deserves more weight in your process?
Look into how the SWS DCF model arrives at its fair value.
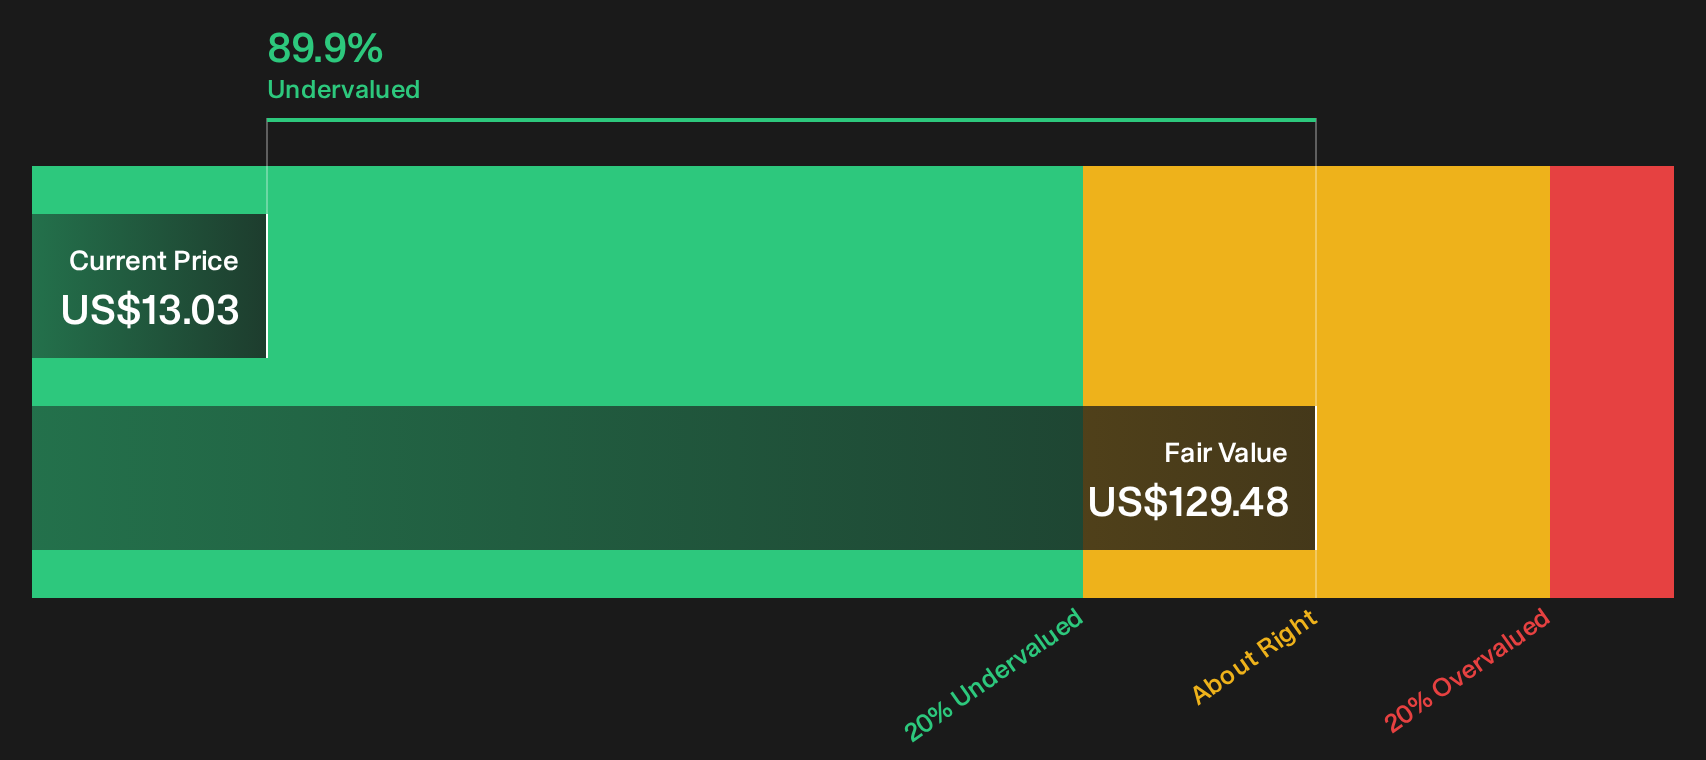
Simply Wall St performs a discounted cash flow (DCF) on every stock in the world every day (check out Replimune Group for example). We show the entire calculation in full. You can track the result in your watchlist or portfolio and be alerted when this changes, or use our stock screener to discover 34 high quality undervalued stocks. If you save a screener we even alert you when new companies match - so you never miss a potential opportunity.
Next Steps
Plenty in this Replimune Group story pulls in opposite directions, with risk flags on one side and clear upside arguments on the other. Act quickly, go through the numbers yourself, and pressure test both angles against the 2 key rewards and 5 important warning signs
Looking for more investment ideas beyond Replimune Group?
If Replimune Group has sharpened your focus on risk and reward, you might broaden your watchlist with other stocks that match clear, rule-based criteria from the Simply Wall St screener.
- Target robust balance sheets and steadier fundamentals by scanning a list of solid balance sheet and fundamentals (22 results) that many investors lean on when they want financial strength front and center.
- Hunt for quality at a discount by reviewing a 34 high quality undervalued stocks that filters for businesses where price and fundamentals may be out of sync.
- Build a cash flow focused watchlist by checking a 6 dividend fortresses that some investors use when they want income potential as well as resilience.
This article by Simply Wall St is general in nature. We provide commentary based on historical data and analyst forecasts only using an unbiased methodology and our articles are not intended to be financial advice. It does not constitute a recommendation to buy or sell any stock, and does not take account of your objectives, or your financial situation. We aim to bring you long-term focused analysis driven by fundamental data. Note that our analysis may not factor in the latest price-sensitive company announcements or qualitative material. Simply Wall St has no position in any stocks mentioned.
Have feedback on this article? Concerned about the content? Get in touch with us directly. Alternatively, email editorial-team@simplywallst.com