
Cenovus Energy (TSX:CVE) Gains Earnings Support As Valuation Questions Linger
Recent optimism around Cenovus Energy (TSX:CVE) has been driven by upward earnings estimate revisions and a fresh look at its consistent dividend, including the recently announced CA$0.16 per share payment.
The renewed optimism shows up clearly in the tape, with Cenovus Energy posting a 9.56% 1‑month share price return and a 30.79% 3‑month move. The 1‑year total shareholder return of 100.29% suggests momentum has been strong rather than fading.
Scan for other energy players that are showing similar earnings momentum and resilient payouts with our curated list of 2 dividend fortresses
Bulls point to Cenovus Energy’s strong recent run and earnings optimism, while bears highlight weaker annual revenue and net income growth. Which story does the current valuation actually support next?
Most Popular Narrative: 3% Overvalued
Cenovus Energy last closed at CA$47.23, slightly above the most followed narrative fair value of CA$45.84. This fair value is based on a 6.354% discount rate and detailed long term cash flow assumptions.
Successful completion of key growth projects such as Narrows Lake, West White Rose, and the Foster Creek optimization is set to deliver significant new, stable, long-life production with lower steam-oil ratios and reduced capital spending needs moving forward, positioning the company for higher free cash flow and earnings as global energy demand remains robust.
See why 106 investors see Cenovus Energy as 3% overvalued.
Result: Fair Value of CA$45.84 (OVERVALUED)
Still, Cenovus Energy’s heavy exposure to oil sands, along with ongoing Canadian regulatory and carbon policy risk, could quickly challenge the current fair value story.
Find out about the key risks to this Cenovus Energy narrative.
Another View: Cenovus Energy Looks Cheap On Earnings
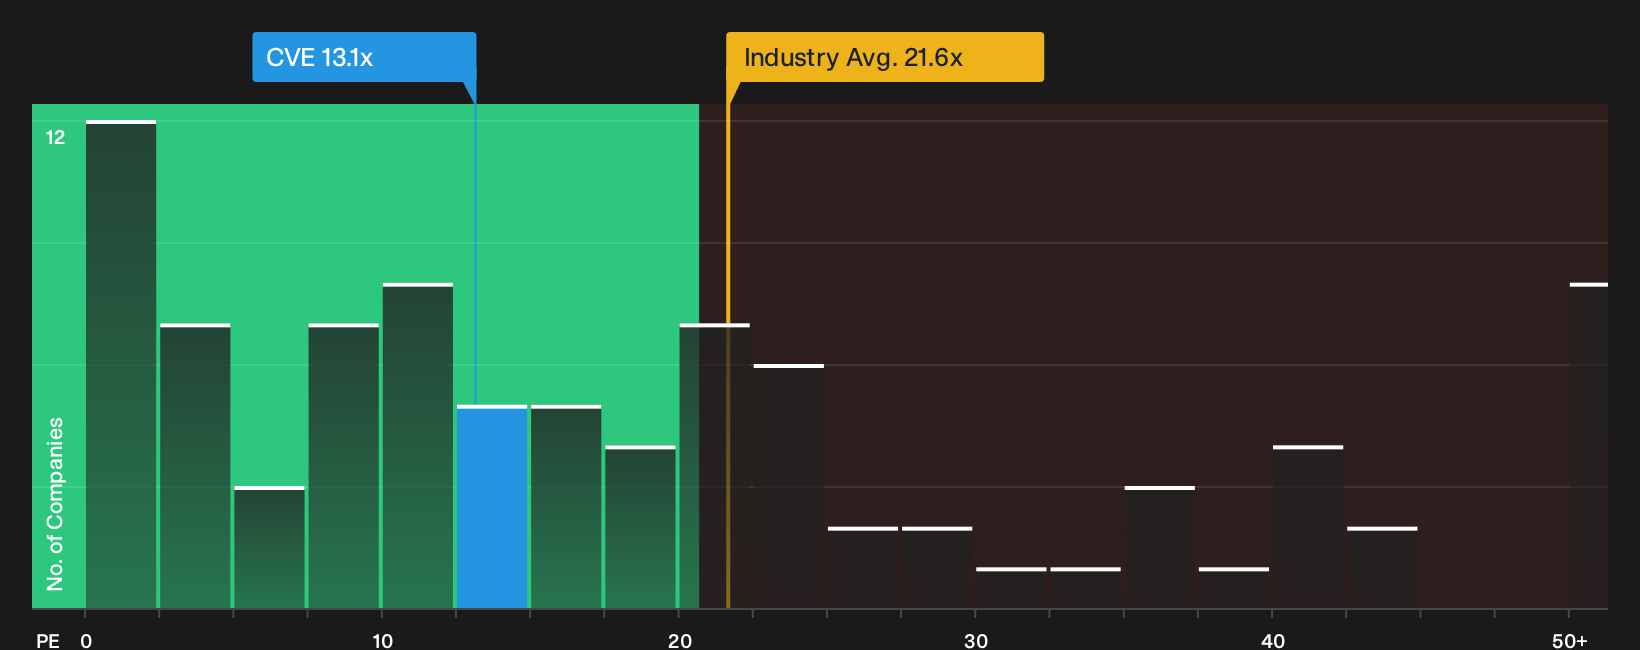
The story changes when you move past the cash flow fair value and instead look at Cenovus Energy through its P/E. At 13.1x earnings versus a fair ratio of 15.1x, and compared with 17.9x for peers and 21.6x for the Canadian Oil and Gas industry, the stock appears to be priced more cautiously than both its own history and its sector. Which valuation perspective matters more for you?
See what the numbers say about this price — find out in our valuation breakdown.
Next Steps
Mixed messages on Cenovus Energy’s value and risk profile so far. If you want to move faster than the crowd, carefully weigh the potential upside against the red flags yourself with 3 key rewards and 3 important warning signs.
Looking for more investment ideas beyond Cenovus Energy?
If Cenovus Energy has you rethinking your watchlist, use this momentum to scan other opportunities that could fit your risk, income, and value goals.
- Target dependable income by reviewing a curated pool of potential high-yield payers through the 2 dividend fortresses.
- Hunt for potential value opportunities that combine quality fundamentals with pricing that may look appealing using the 3 high quality undervalued stocks.
- Prioritise resilience in choppy markets by focusing on companies with robust financial footing through the list of solid balance sheet and fundamentals (7 results).
This article by Simply Wall St is general in nature. We provide commentary based on historical data and analyst forecasts only using an unbiased methodology and our articles are not intended to be financial advice. It does not constitute a recommendation to buy or sell any stock, and does not take account of your objectives, or your financial situation. We aim to bring you long-term focused analysis driven by fundamental data. Note that our analysis may not factor in the latest price-sensitive company announcements or qualitative material. Simply Wall St has no position in any stocks mentioned.
Have feedback on this article? Concerned about the content? Get in touch with us directly. Alternatively, email editorial-team@simplywallst.com