
Yamada Holdings (TSE:9831) Extends Its Run As Valuation Questions Build
Recent trading in Yamada Holdings (TSE:9831) has drawn attention after a steady run, with the share price closing at ¥718.4 as investors weigh its electronics retail, housing, financial, and environmental operations.
Across recent months, Yamada Holdings has seen firm momentum, with a 30 day share price return of 4.85% and a 90 day share price return of 10.61%, contributing to a year to date share price gain of 36.92% and a 1 year total shareholder return of 50.85%. This suggests that investors have been rewarding the broader business mix rather than just short term trading moves.
Scan how Yamada Holdings compares with other retailers showing strong recent share price moves by reviewing the curated 16 high quality undervalued stocks, which also pairs momentum with fundamentals.
After that kind of run, the puzzle is not whether Yamada Holdings has momentum. Instead, the question is where fair value sits between the current ¥718.4 price and the range of analyst and intrinsic estimates.
Price-to-Earnings of 30x: Is it justified?
Yamada Holdings trades on a P/E of 30x, which sits against a last close of ¥718.4 and points to a rich earnings valuation compared with peers.
The P/E ratio compares the current share price to earnings per share and gives you a quick read on how much investors are willing to pay for each unit of profit. For a retailer like Yamada Holdings, that figure often reflects expectations around future earnings resilience, the breadth of its business mix, and how dependable profits look across cycles.
Here, the numbers lean firmly to the expensive side. The stock carries a P/E of 30x, while the estimated fair P/E is 21x. That fair level is what our model suggests the valuation could gravitate toward based on underlying relationships between fundamentals and pricing. The same 30x multiple also sits far above the JP Specialty Retail industry average of 13.4x and the peer group average of 12.5x, which indicates the market is paying a much higher price for Yamada Holdings earnings than for comparable retailers.
Explore the SWS fair ratio for Yamada Holdings.
Result: Price-to-Earnings of 30x (OVERVALUED)
Still, if analyst price targets remain below the current ¥718.4 level and intrinsic estimates imply a discount, the premium on Yamada Holdings could unwind quickly.
Find out about the key risks to this Yamada Holdings narrative.
Another view on Yamada Holdings valuation
The P/E discussion points to a premium, yet the SWS DCF model paints an even starker picture. On that cash flow view, Yamada Holdings at ¥718.4 trades well above an estimated future cash flow value of ¥328.91, which suggests the shares screen as expensive rather than cheap. So which signal should carry more weight for you right now?
Look into how the SWS DCF model arrives at its fair value.
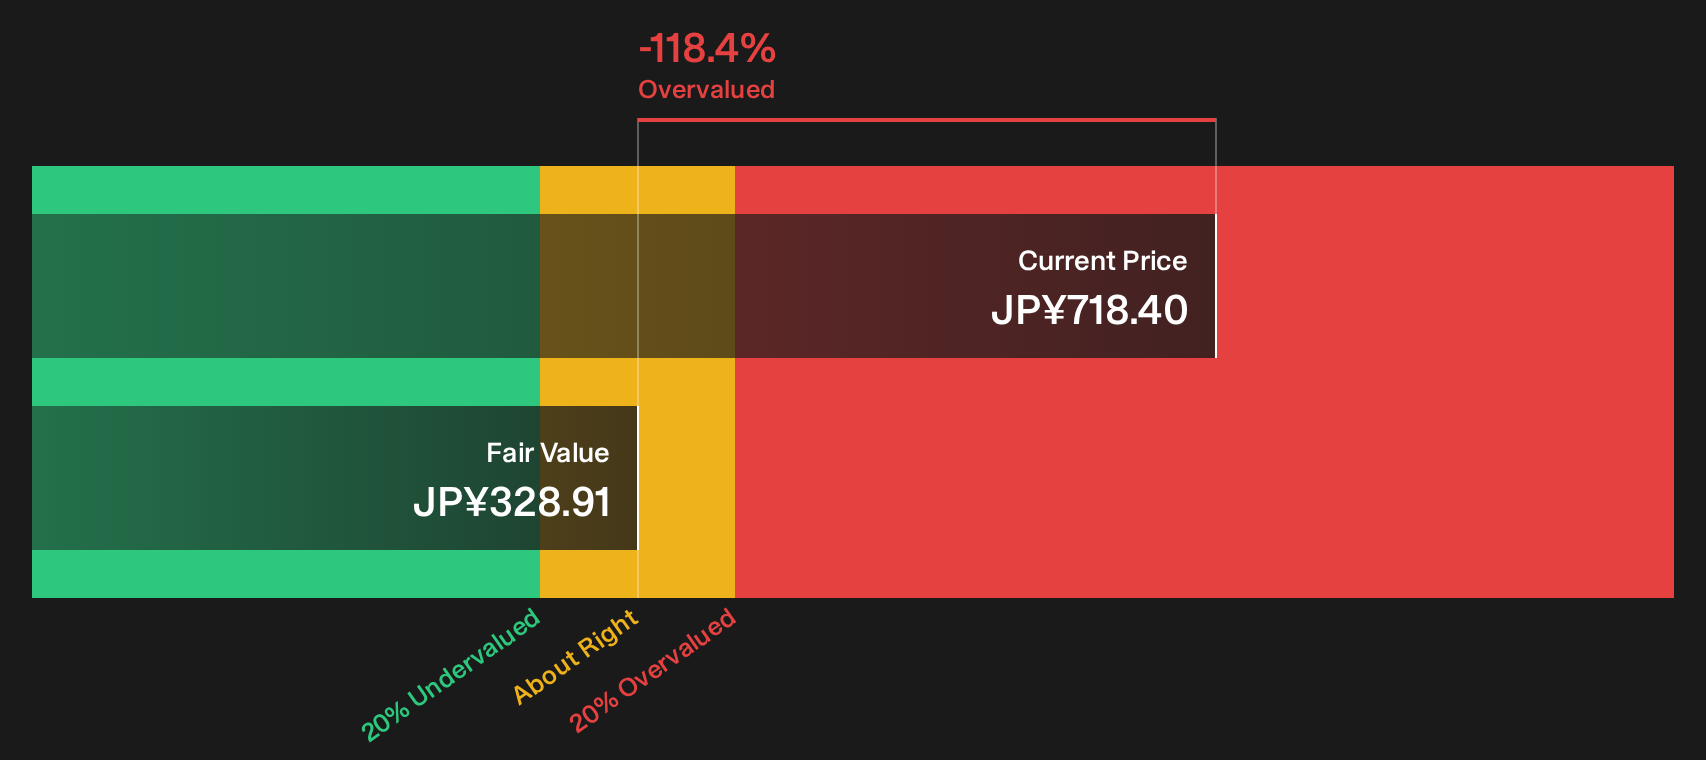
Simply Wall St performs a discounted cash flow (DCF) on every stock in the world every day (check out Yamada Holdings for example). We show the entire calculation in full. You can track the result in your watchlist or portfolio and be alerted when this changes, or use our stock screener to discover 16 high quality undervalued stocks. If you save a screener we even alert you when new companies match - so you never miss a potential opportunity.
Next Steps
Sentiment around Yamada Holdings is clearly split, with enthusiasm on one side and caution on the other. Move quickly, review the full data, and weigh both the 1 key reward and 3 important warning signs in the 1 key reward and 3 important warning signs.
Looking for more investment ideas beyond Yamada Holdings?
If you want a broader view of opportunities, use the Simply Wall Street Screener to spot fresh ideas before they move and build a tighter watchlist.
- Target reliable cash generators by scanning companies with strong financial resilience using the list of solid balance sheet and fundamentals (20 results).
- Hunt for mispriced quality by focusing on businesses that combine attractive pricing with robust fundamentals in the 16 high quality undervalued stocks.
- Stack potential income streams by reviewing financially grounded stocks that offer higher yields through the 17 dividend fortresses.
This article by Simply Wall St is general in nature. We provide commentary based on historical data and analyst forecasts only using an unbiased methodology and our articles are not intended to be financial advice. It does not constitute a recommendation to buy or sell any stock, and does not take account of your objectives, or your financial situation. We aim to bring you long-term focused analysis driven by fundamental data. Note that our analysis may not factor in the latest price-sensitive company announcements or qualitative material. Simply Wall St has no position in any stocks mentioned.
Have feedback on this article? Concerned about the content? Get in touch with us directly. Alternatively, email editorial-team@simplywallst.com