
Is Pharvaris (PHVS) Too Expensive After Its Phase 3 Results?
Pharvaris has been on a strong multi year run, helped by fresh clinical data in hereditary angioedema, which naturally puts the spotlight on whether the current share price lines up with what its balance sheet supports. With the stock now drawing more attention, the key issue for anyone looking at Pharvaris is how today’s market value stacks up against its book value and the industry average.
- Over the past 5 years, Pharvaris has delivered a total return of 111.0%, which raises the question of how much of that move is backed by the equity on its balance sheet.
- Positive Phase 3 results for deucrictibant XR and a planned 2027 FDA submission can shape expectations for future cash needs and potential earnings power, both of which matter when you compare the stock’s price to its book value.
- There is a second opinion on Pharvaris worth weighing. See what analysts think Pharvaris's shares could be worth.
The issue now is whether Pharvaris's current share price is adequately supported by its book value when set against the industry average.
If you are weighing Pharvaris against other opportunities that hinge on balance sheet support and valuation, it can help to compare it with stocks in the 34 high quality undervalued stocks.
Is Pharvaris Getting Expensive on Book Value?
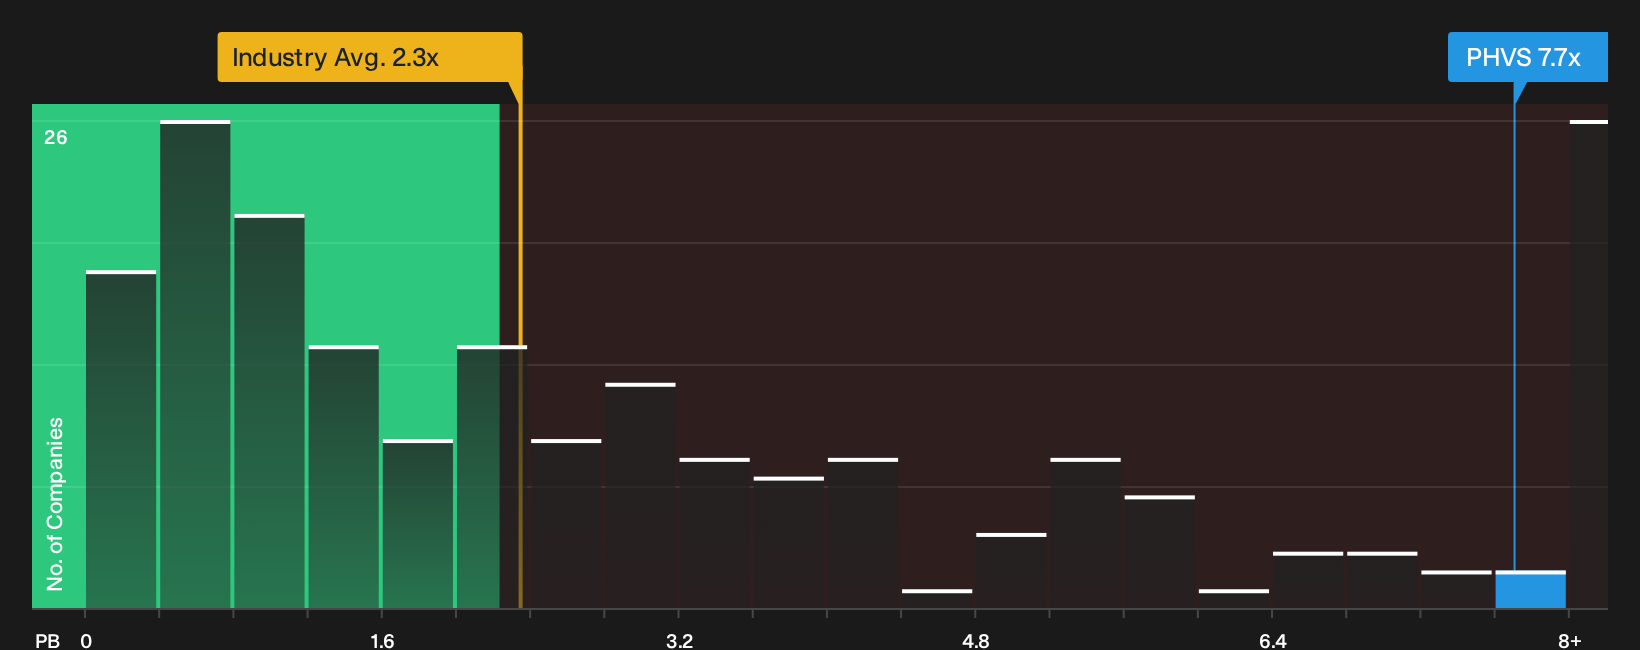
P/B is a useful yardstick for Pharvaris because the story is still about assets, pipeline and cash rather than established profits. On this measure, the stock trades on a P/B of about 7.7x, compared with an industry average of roughly 2.3x for Pharmaceuticals. That is a sizeable premium to the typical balance sheet multiple in the sector, which points to investors paying a high price relative to Pharvaris's accounting equity.
Because the recent Phase 3 deucrictibant XR news has sharpened expectations around future opportunities, the market appears willing to accept this richer P/B level. The gap to the industry average is large, and the valuation model heavily penalises the current losses and risk profile, so the implied benchmark is best read as a warning flag that Pharvaris screens as overvalued on this framework rather than a precise target. This kind of multiple usually asks you to be confident that the pipeline eventually justifies paying so much for each dollar of book value. Explore the numbers behind Pharvaris's P/B valuation.
The Pharvaris Narrative: What Would Justify Today's Price?
Simply Wall St Narratives pick up where Pharvaris' P/B puzzle leaves off by explaining what kind of growth, margins and earnings profile would need to occur for the valuation to end up materially above or below today's price. These Narratives are available on the stock's Community page. Each Narrative treats fair value as a hypothesis about Pharvaris' business that can be tracked over time, allowing you to see how the story holds up as new information arrives.
A written, number driven view on Pharvaris gives you a way to pin down assumptions around whether the recent deucrictibant XR Phase 3 data and planned 2027 FDA submission ultimately support today’s valuation. It turns the current excitement into a testable roadmap that can be checked against future trial updates, regulatory milestones and any shift in the stock’s P/B profile.
Share your own Narrative for Pharvaris and set out the assumptions behind your valuation.
Before you act on Pharvaris's valuation, there is one more angle to check
There is a separate lens on Pharvaris that comes from where professional equity analysts currently project the business a few years out, which gives you another benchmark to compare with today’s pricing. Explore where analysts expect Pharvaris to be in a few years.
This article by Simply Wall St is general in nature. We provide commentary based on historical data and analyst forecasts only using an unbiased methodology and our articles are not intended to be financial advice. It does not constitute a recommendation to buy or sell any stock, and does not take account of your objectives, or your financial situation. We aim to bring you long-term focused analysis driven by fundamental data. Note that our analysis may not factor in the latest price-sensitive company announcements or qualitative material. Simply Wall St has no position in any stocks mentioned.
Have feedback on this article? Concerned about the content? Get in touch with us directly. Alternatively, email editorial-team@simplywallst.com